Fig. 2
Download original image
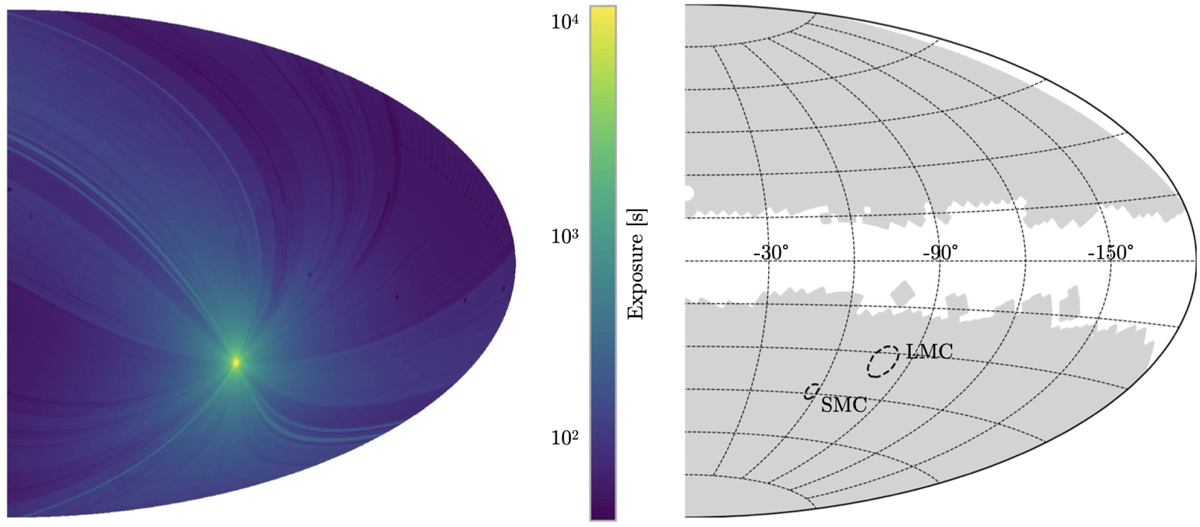
Representation of eROSITA_DE sky in Aitoff projection in Galactic coordinates. The left panel shows the (vignetted) effective eRASSl exposure map with values ranging from ≈100 s (blue) at the ecliptic equator to more than 10000 s (yellow) close to the ecliptic pole. The right panel shows the LS10 footprint in the same projection and coordinates, covering 76% of eROSITA_DE. The locations of Large Magellanic Cloud (LMC) and Small Magellanic Cloud (SMC) are shown for illustrative purposes.
Current usage metrics show cumulative count of Article Views (full-text article views including HTML views, PDF and ePub downloads, according to the available data) and Abstracts Views on Vision4Press platform.
Data correspond to usage on the plateform after 2015. The current usage metrics is available 48-96 hours after online publication and is updated daily on week days.
Initial download of the metrics may take a while.