Fig. 13
Download original image
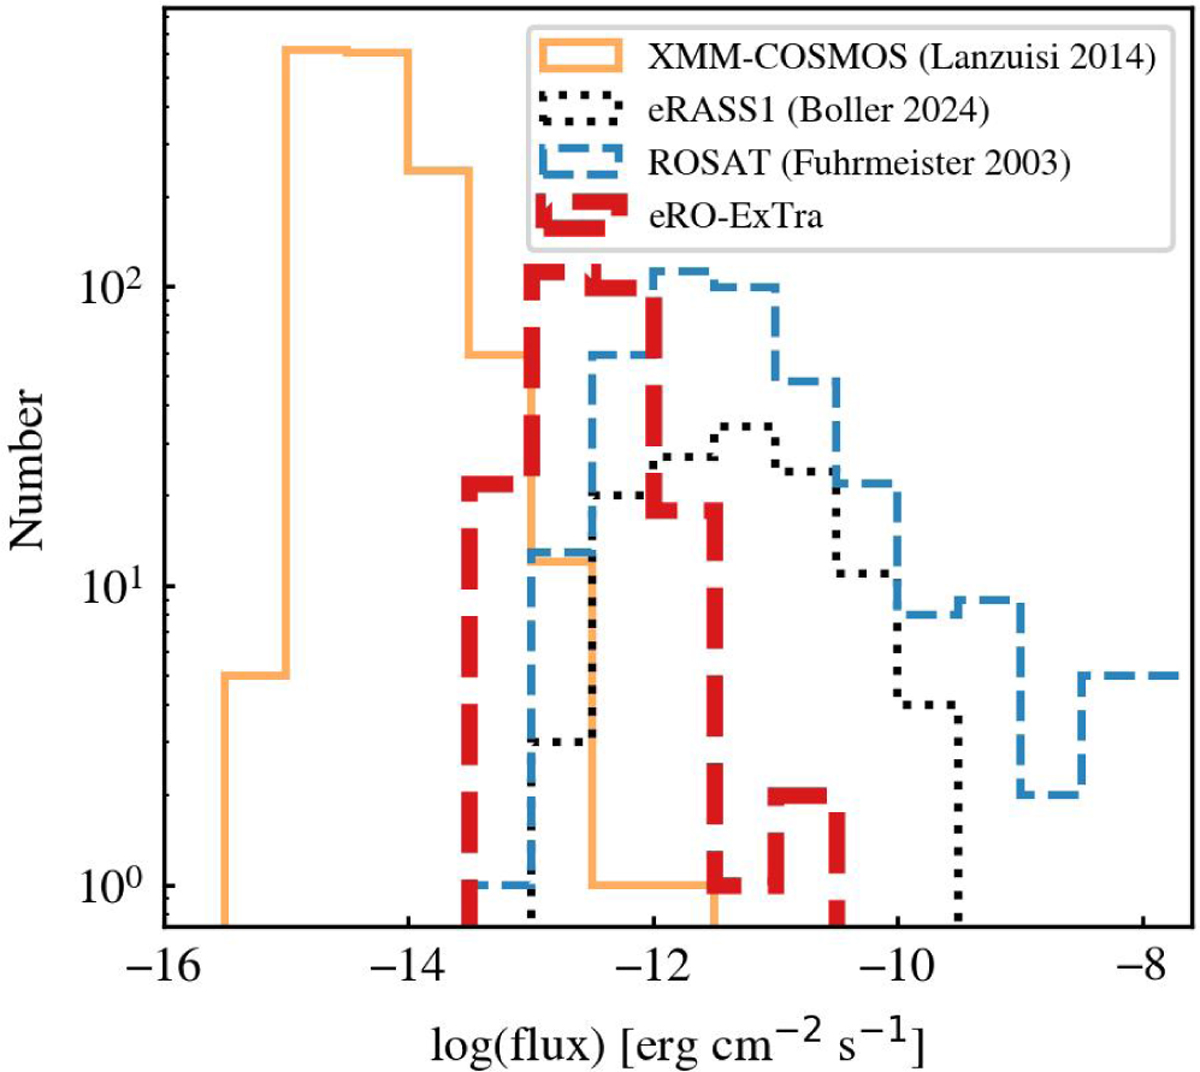
Comparison of 0.2–2.3 keV flux distributions of eRO-ExTra with those of variable or transient extragalactic sources in previous studies. The dashed red line shows this study, the orange line shows XMM-COSMOS (Lanzuisi et al. 2014), the dotted black line shows eRASS1 (Boller et al. 2024), and the dashed blue line shows ROSAT (Fuhrmeister & Schmitt 2003).
Current usage metrics show cumulative count of Article Views (full-text article views including HTML views, PDF and ePub downloads, according to the available data) and Abstracts Views on Vision4Press platform.
Data correspond to usage on the plateform after 2015. The current usage metrics is available 48-96 hours after online publication and is updated daily on week days.
Initial download of the metrics may take a while.