Open Access
Fig. 11
Download original image
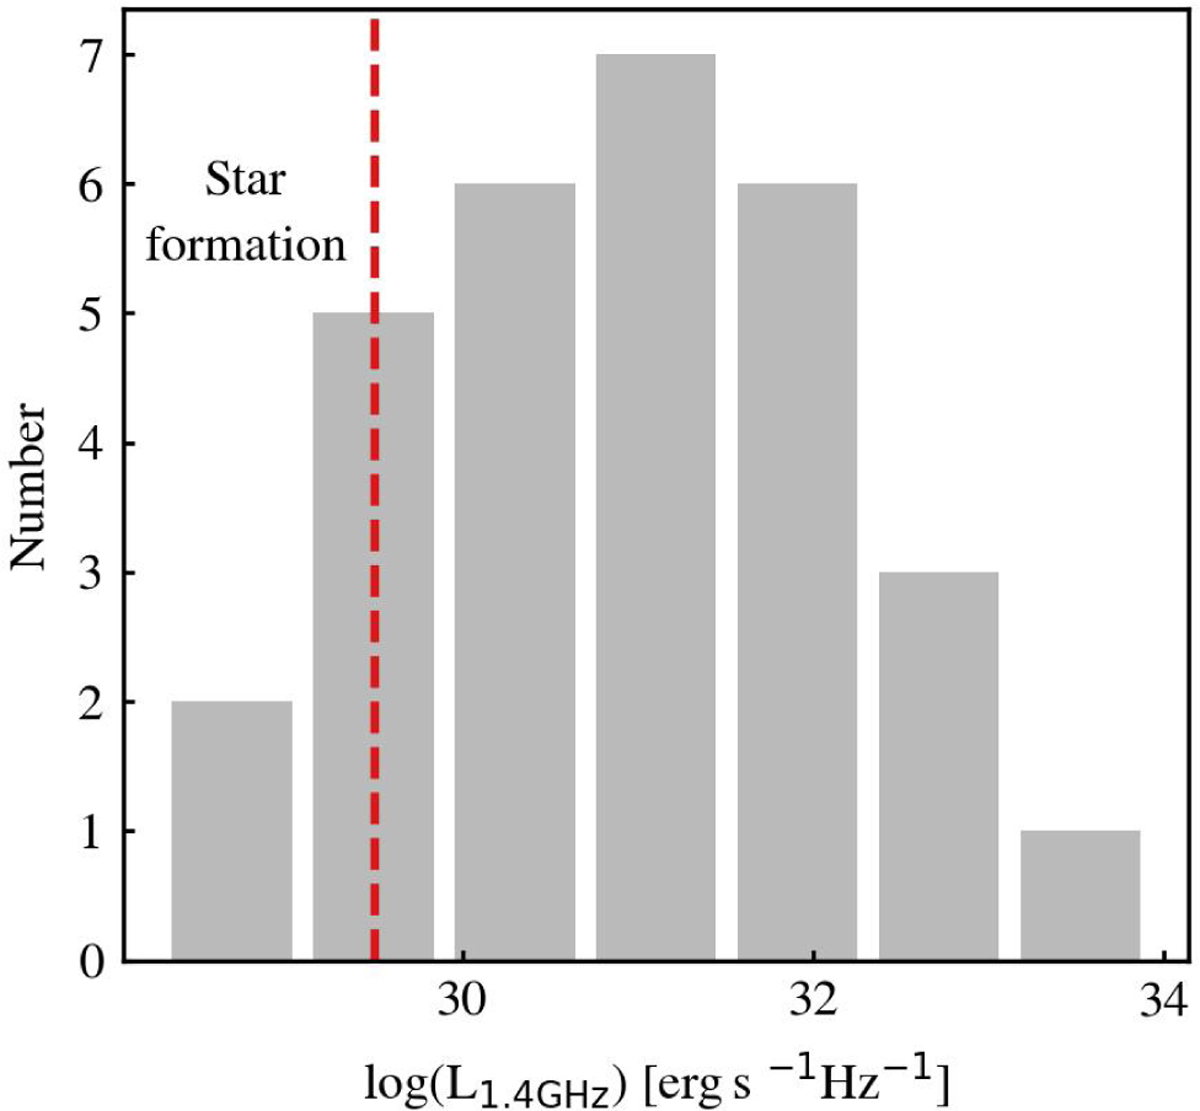
Radio luminosity distribution at 1.4 GHz for 30 RACS-detected sources. The dashed red line shows the radio luminosity corresponding to star formation rate SFR = 20 M⊙yr−1. Radio emission of ≈20% of sources can be explained by star formation, while higher luminosities for remaining sources suggest other emission processes.
Current usage metrics show cumulative count of Article Views (full-text article views including HTML views, PDF and ePub downloads, according to the available data) and Abstracts Views on Vision4Press platform.
Data correspond to usage on the plateform after 2015. The current usage metrics is available 48-96 hours after online publication and is updated daily on week days.
Initial download of the metrics may take a while.