Fig. 8.
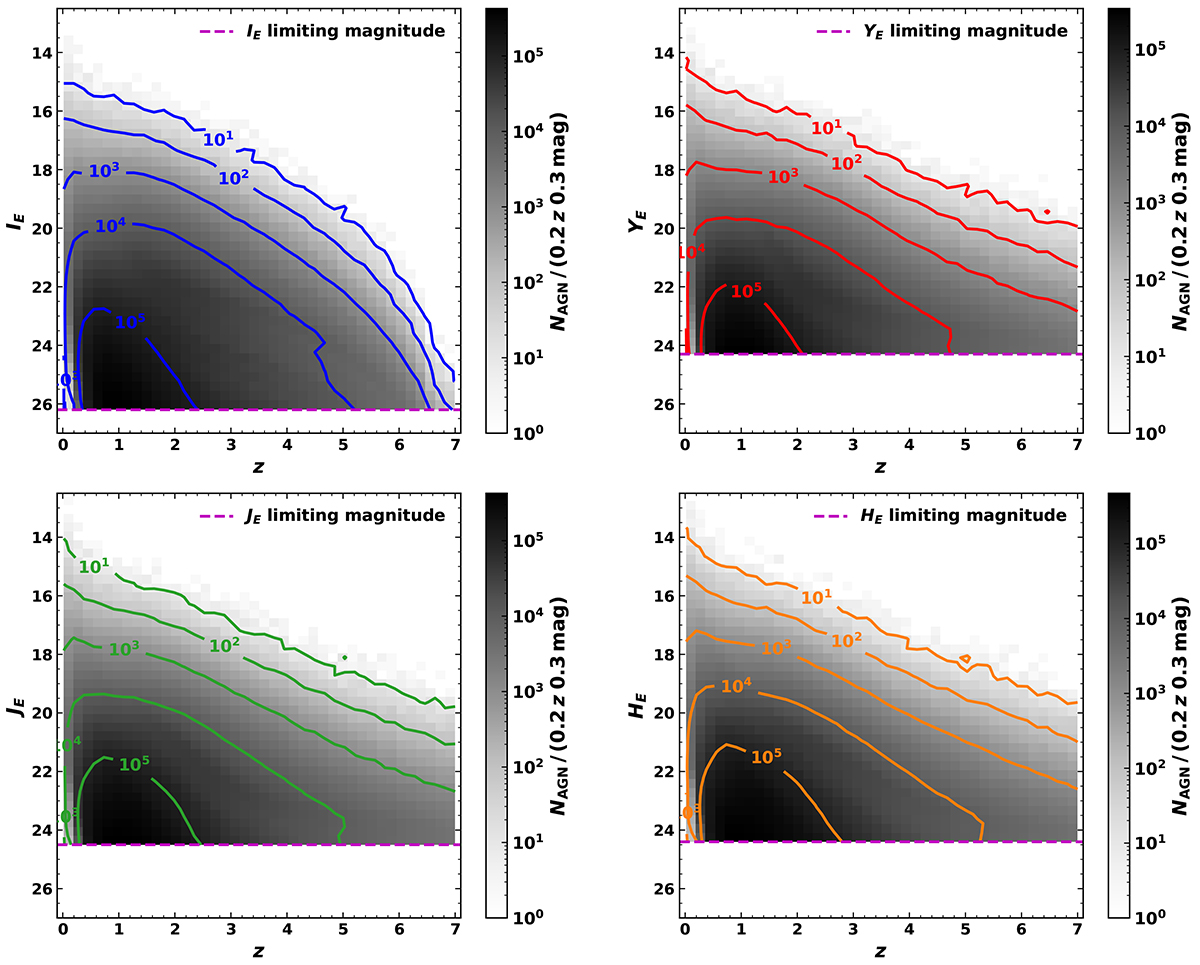
Download original image
Observed magnitude vs redshift density distributions for observable AGN in Euclid’s four photometric filters in the EWS. Two-dimensional histograms representing the density of observed AGN are plotted in grey-scale. Subplots correspond to IE (top left), YE (top right), JE (bottom left), and HE (bottom right). The data are binned with 40 bins in the x and y domains, giving two-dimensional AGN density in units of NAGN/(0.2 z, 0.3 mag). Contours of constant log10 NAGN are plotted for log10 NAGN = (1, 2, 3, 4, 5). Lines depicting the limiting magnitude in the EWS for each filter are plotted in dashed magenta lines.
Current usage metrics show cumulative count of Article Views (full-text article views including HTML views, PDF and ePub downloads, according to the available data) and Abstracts Views on Vision4Press platform.
Data correspond to usage on the plateform after 2015. The current usage metrics is available 48-96 hours after online publication and is updated daily on week days.
Initial download of the metrics may take a while.