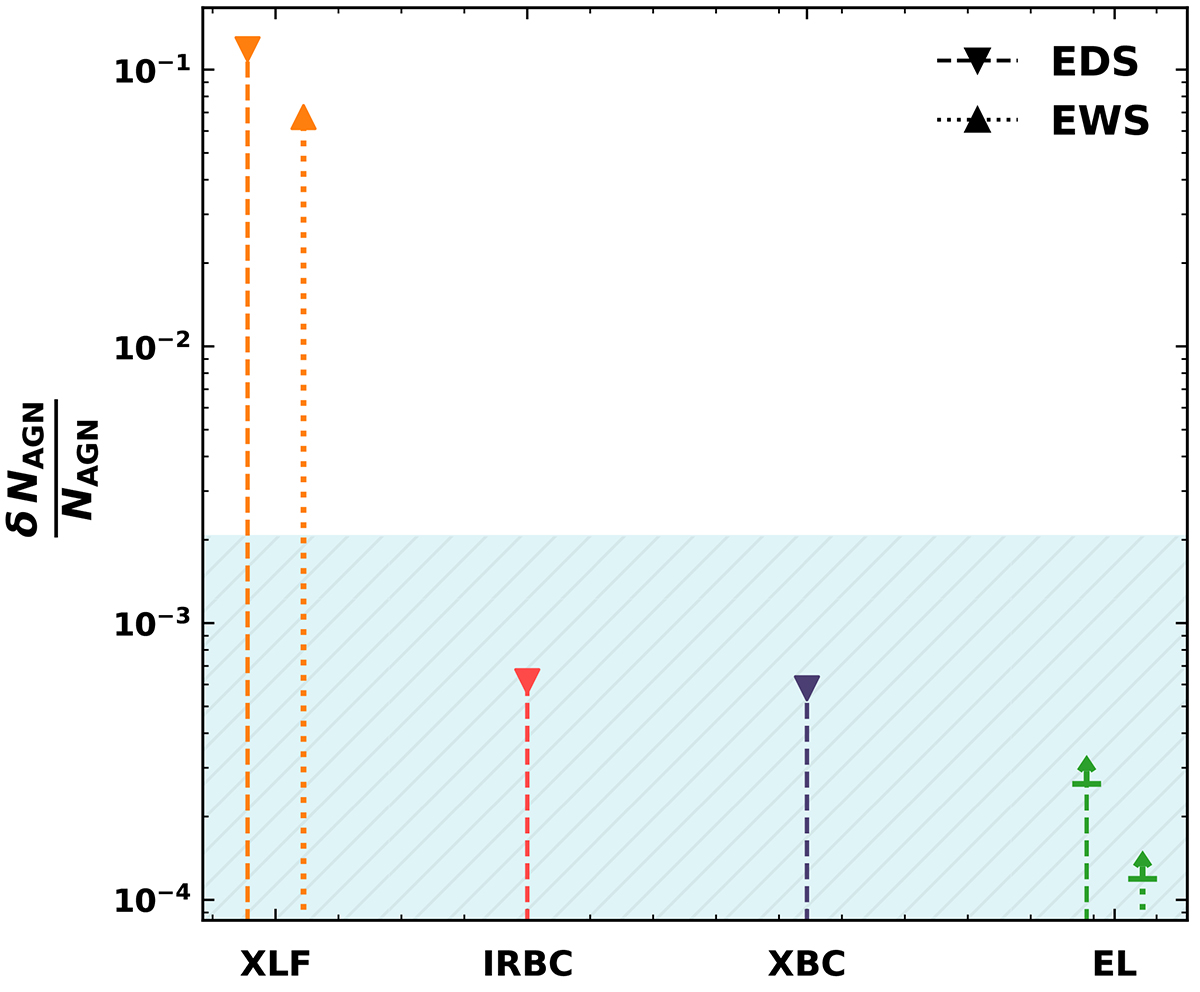
Fig. 12.
Download original image
Relative 1σ uncertainty of the number of AGN detectable in at least one Euclid band (NAGN) for each of the quantified sources of uncertainty introduced in this work. Displayed in this plot are uncertainties introduced by the X-ray luminosity function (XLF), infrared bolometric correction dispersion (IRBC), X-ray bolometric correction dispersion (XBC) and unobscured AGN emission lines (EL) for which a lower limit was quantified using the Lyα emission line and Hα+[N II] complex. The expected relative Poisson noise for the EDS, calculated as ![]() , is indicated by the shaded blue region.
, is indicated by the shaded blue region.
Current usage metrics show cumulative count of Article Views (full-text article views including HTML views, PDF and ePub downloads, according to the available data) and Abstracts Views on Vision4Press platform.
Data correspond to usage on the plateform after 2015. The current usage metrics is available 48-96 hours after online publication and is updated daily on week days.
Initial download of the metrics may take a while.