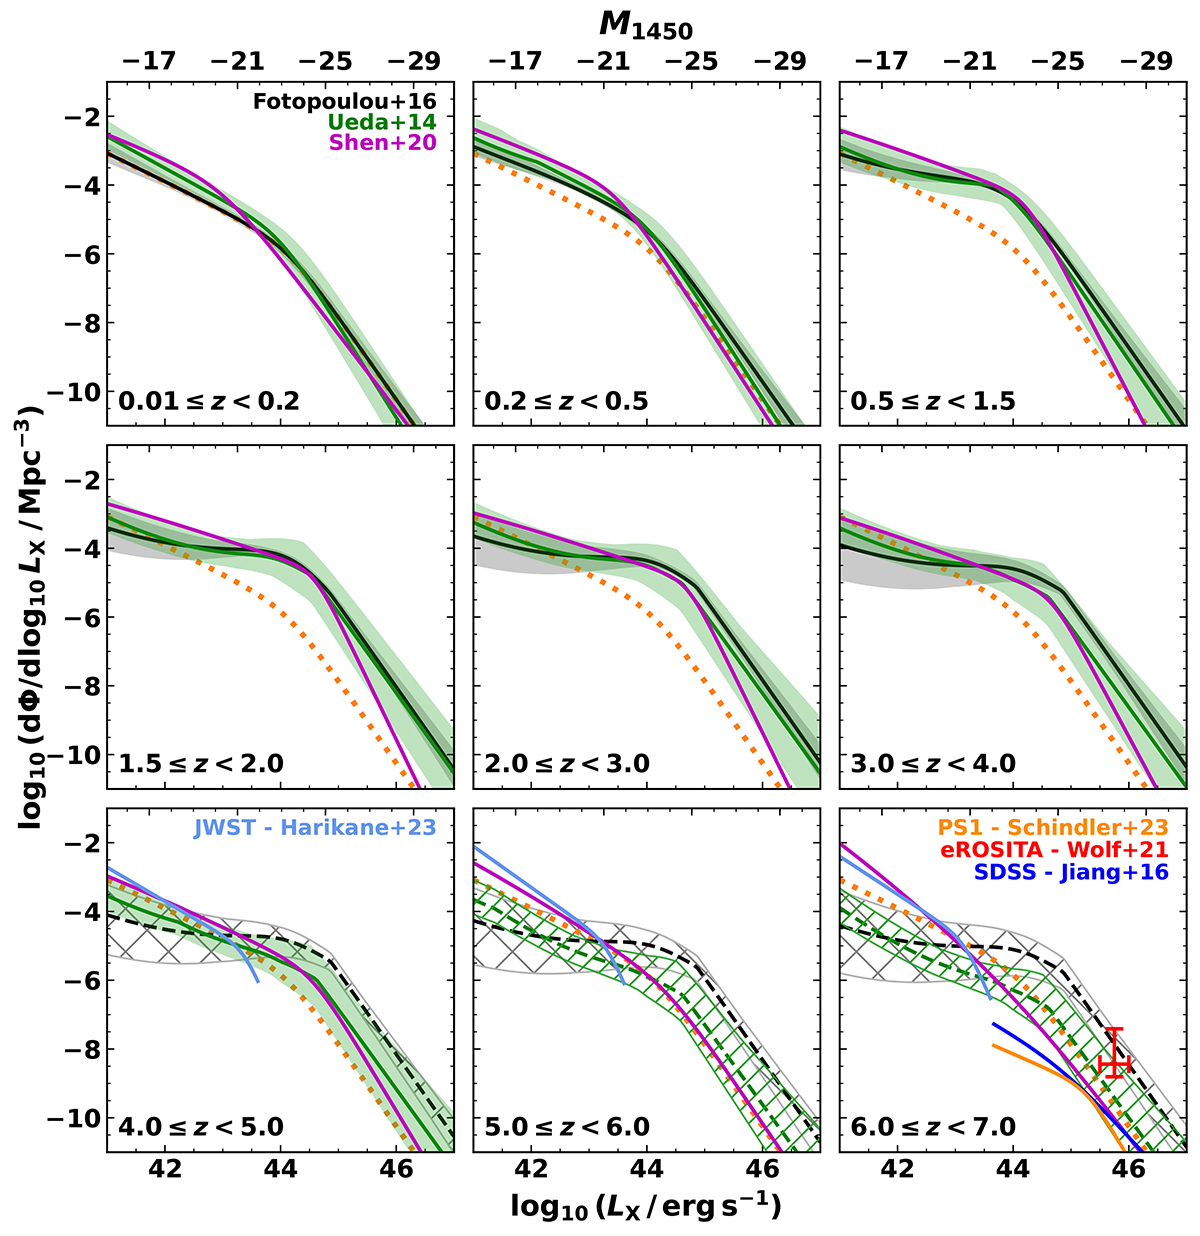
Fig. 1.
Download original image
Comparison of different AGN LFs homogenised to the 2–10 keV X-ray band. Corresponding absolute UV magnitudes at 1450 Å, M1450, are displayed on the upper axes. In each panel the LFs are realised for the central redshift value. The hard X-ray LF of Fotopoulou et al. (2016a) employed in this work is shown in black. The grey shaded regions depict the 1σ uncertainty. For reference, we plot the Fotopoulou et al. (2016a) XLF evaluated at z = 0.1 as orange dotted lines in each panel. The hard XLF of Ueda et al. (2014) is shown in green, with the green shaded regions corresponding to the 1σ uncertainty generated with sampling from the published parameter uncertainties. The magenta lines portray the bolometric quasar LF of Shen et al. (2020), converted to the X-ray domain. The light blue lines portray the Harikane et al. (2023)z > 4 faint unobscured AGN LF derived with JWST/NIRSpec deep spectroscopy. In the final panel the Jiang et al. (2016)z > 6 SDSS quasar LF is represented by the blue curve. The solid orange curve gives the Schindler et al. (2023)z ∼ 6 quasar LF derived from Pan-STARRS1 and SHELLQs observations. The red uncertainty interval represents eROSITA high-redshift constraints on the XLF (Wolf et al. 2021). In all cases dashed curves and hatched uncertainty intervals indicate extrapolation.
Current usage metrics show cumulative count of Article Views (full-text article views including HTML views, PDF and ePub downloads, according to the available data) and Abstracts Views on Vision4Press platform.
Data correspond to usage on the plateform after 2015. The current usage metrics is available 48-96 hours after online publication and is updated daily on week days.
Initial download of the metrics may take a while.