Fig. 3.
Download original image
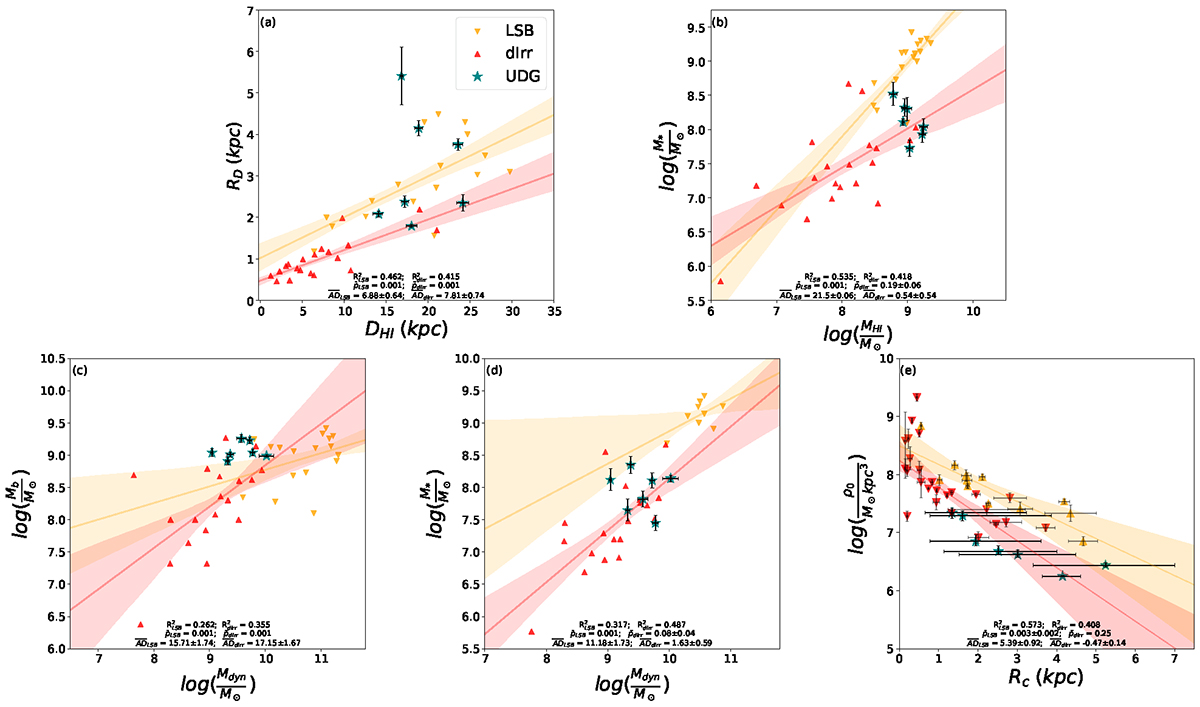
Scaling relations between several mass and structural properties of our galaxy samples. In the top row, (a) HI diameter versus exponential stellar scale radius (DHI vs. RD), (b) stellar mass versus HI mass (log M* vs. log MHI); in the bottom row, (c) total baryonic mass versus total dynamical mass enclosed in within 4 RD (log Mb vs. log Mdyn), (d) stellar mass versus total dynamical mass (log M* vs. log Mdyn), (e) dark matter core density versus core density (ρ0 vs. Rc). In all plots, the regression fits for LSBs and dIrrs with their 68% (1-standard deviation) confidence intervals are shown in yellow and red, respectively, and the data for UDGs are superposed on their regression fits with teal stars. The R2 values for the regression fit for LSBs and dIrrs (RLSB2 and RdIrr2, respectively) are mentioned at the bottom of each plot. Also, ![]() and
and ![]() are mentioned at the bottom of each plot, which measure the compliance of the UDG data with LSB or dIrr regression fit (
are mentioned at the bottom of each plot, which measure the compliance of the UDG data with LSB or dIrr regression fit (![]() ,
, ![]() ,
, ![]() , and
, and ![]() , respectively) obtained from the two-sample Anderson-Darling test. The steps of obtaining the
, respectively) obtained from the two-sample Anderson-Darling test. The steps of obtaining the ![]() and
and ![]() values are mentioned in Sect. 7.1.
values are mentioned in Sect. 7.1.
Current usage metrics show cumulative count of Article Views (full-text article views including HTML views, PDF and ePub downloads, according to the available data) and Abstracts Views on Vision4Press platform.
Data correspond to usage on the plateform after 2015. The current usage metrics is available 48-96 hours after online publication and is updated daily on week days.
Initial download of the metrics may take a while.