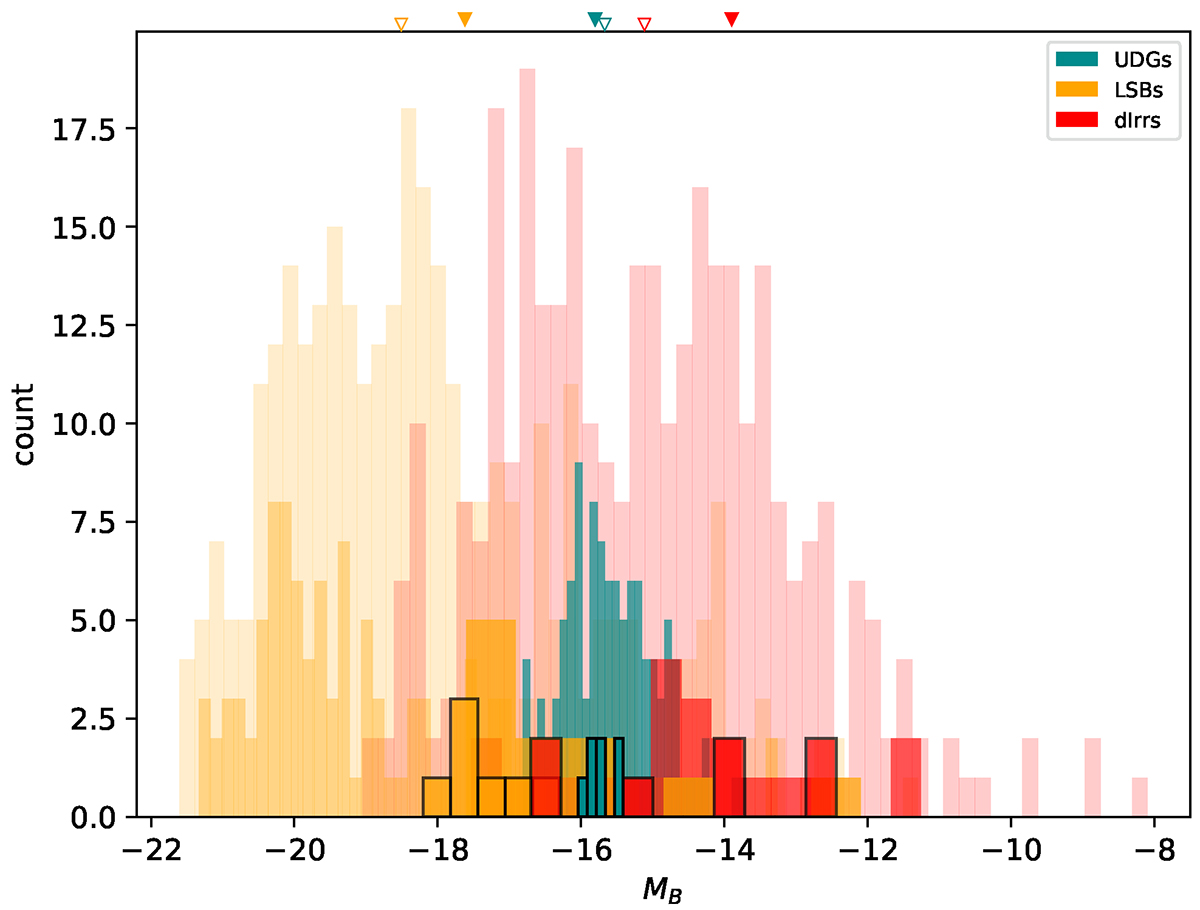
Fig. 2.
Download original image
Distribution of the UDGs, LSBs, and the dIrrs in the MB space with the UDGs, LSBs, and the dIrrs being represented by teal, yellow, and red colours, respectively. The empty and solid triangles on top of the plot represent the median MB, respectively, of the parent populations and the samples considered in our work. The galaxies were chosen from the literature as follows (ordered as the increasing shade of the histograms): (1) UDGs: Leisman et al. (2017); (2) LSBs: Impey et al. (1996), Kniazev et al. (2004), and de Blok et al. (1996); (3) dIrrs: Hunter & Elmegreen (2006) and van Zee & Haynes (2006). The histograms with black outlines represent the samples considered in our study.
Current usage metrics show cumulative count of Article Views (full-text article views including HTML views, PDF and ePub downloads, according to the available data) and Abstracts Views on Vision4Press platform.
Data correspond to usage on the plateform after 2015. The current usage metrics is available 48-96 hours after online publication and is updated daily on week days.
Initial download of the metrics may take a while.