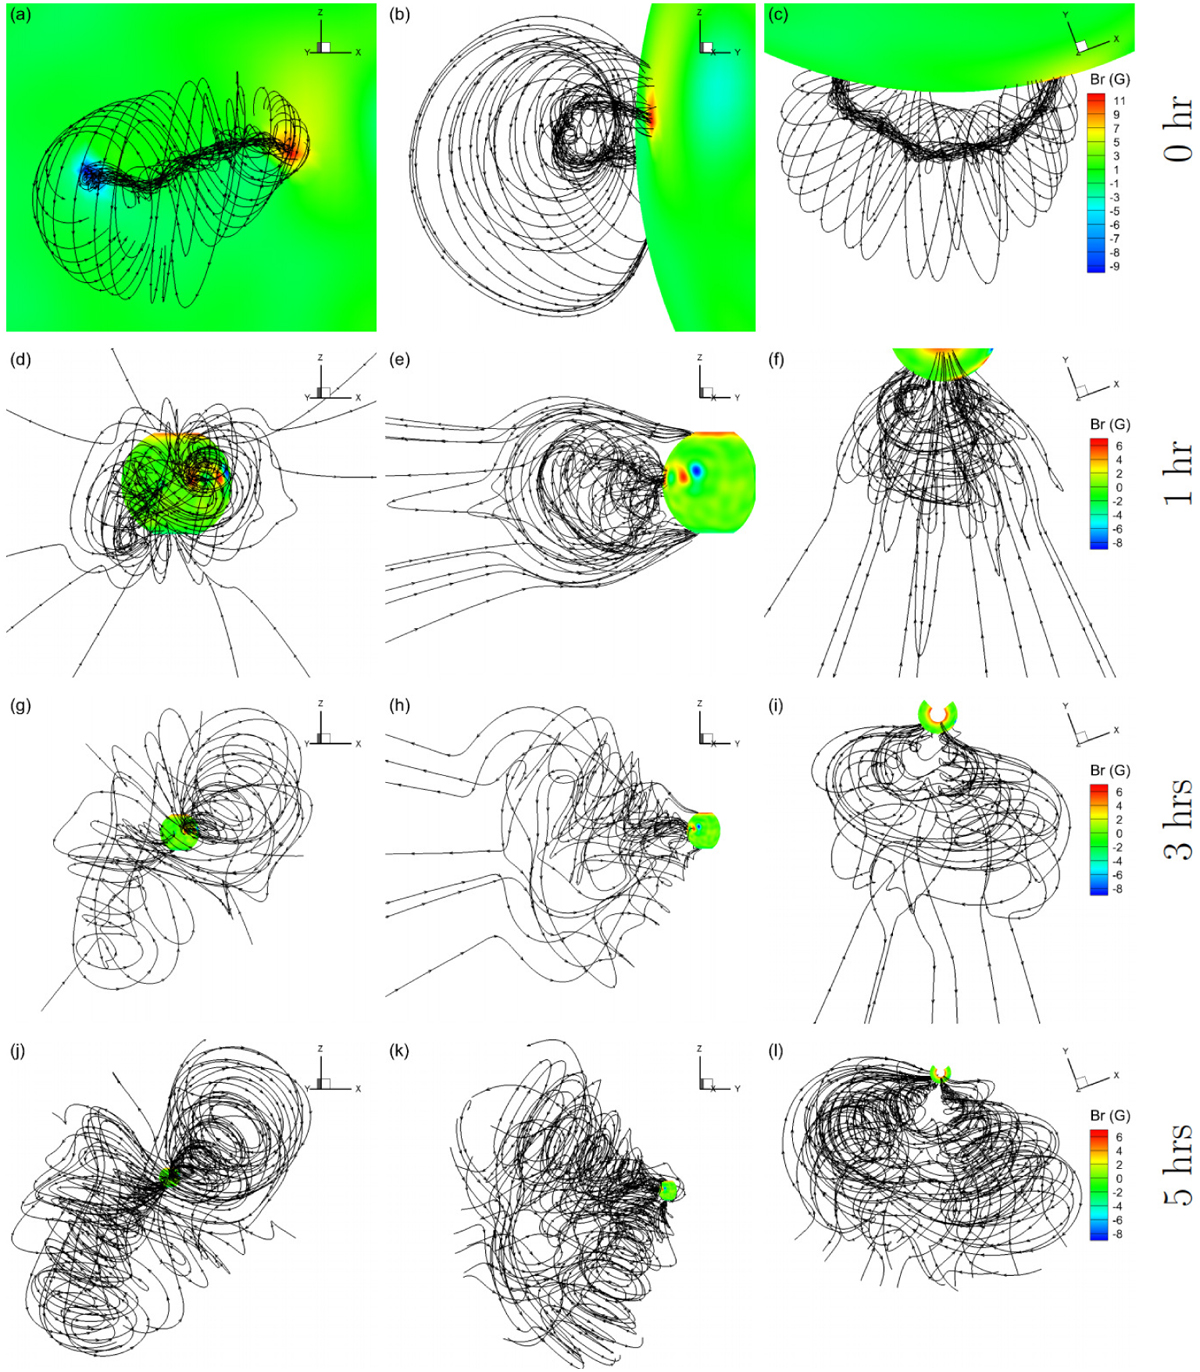
Fig. 5
Download original image
3D view of the magnetic field topology in the corona of CR 2219. These solid lines are representative magnetic field lines displaying the global evolution of the CME and traced from magnetic field in the region of (1 Rs ≤ r ≤ 20Rs) × (22.5° ≤ θ ≤ 157.5°) × (29° ≤ ϕ ≤ 299°) which encloses the theoretical ‘S’ shape flux rope. Rows 1–4 correspond to the simulation results of the CME simulation at 0, 1, 3 and 5 hours, respectively. The magnetic field lines illustrated in the left panel (a, d, g, j) are viewed from a direction of (θ, ϕ) = (90°, 250°), middle panel (b, e, h, k) from a direction of (θ, ϕ) = (90°, 340°), and right panel (c, f, i, l) from the direction of the Z axis, these three directions of sight are orthogonal with respect to each other.
Current usage metrics show cumulative count of Article Views (full-text article views including HTML views, PDF and ePub downloads, according to the available data) and Abstracts Views on Vision4Press platform.
Data correspond to usage on the plateform after 2015. The current usage metrics is available 48-96 hours after online publication and is updated daily on week days.
Initial download of the metrics may take a while.