Fig. 2
Download original image
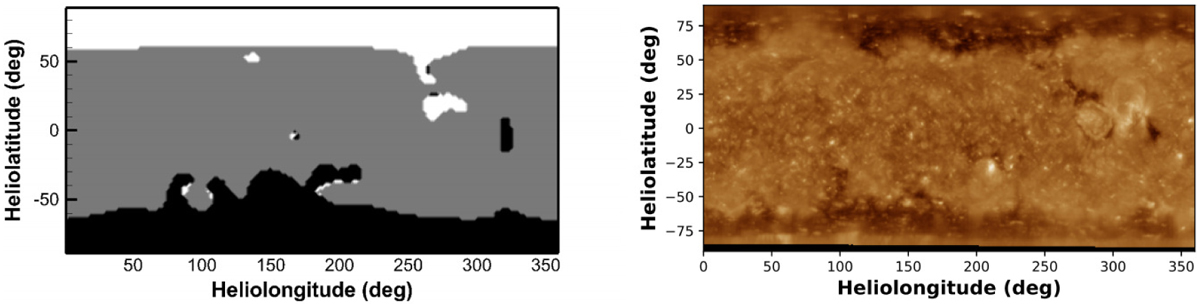
Synoptic maps of the open-field regions modelled by the quasi-steady-state SIP-IFVM MHD model (left), and extreme ultraviolet observations from the 193 Å channel of AIA on board SDO (right) for CR 2219. In the synoptic map, the white and black patches denote open-field regions where the magnetic field lines point outwards and inwards to the Sun, respectively, and the grain patches denote the close-field regions.
Current usage metrics show cumulative count of Article Views (full-text article views including HTML views, PDF and ePub downloads, according to the available data) and Abstracts Views on Vision4Press platform.
Data correspond to usage on the plateform after 2015. The current usage metrics is available 48-96 hours after online publication and is updated daily on week days.
Initial download of the metrics may take a while.