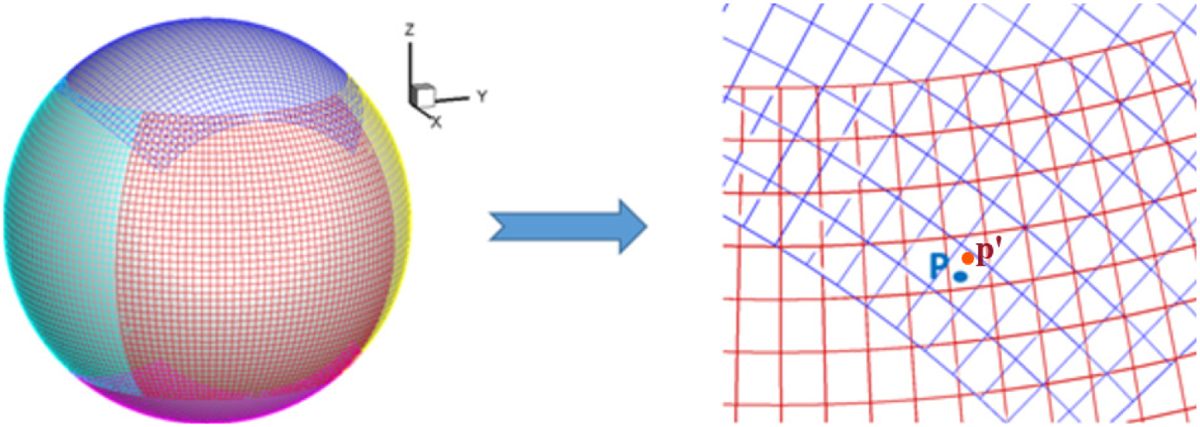
Fig. B.1
Download original image
Illustration of the data communication between different components. The point denoted by P is a centroid of the ghost cell of the component with blue grids and is also in the computation domain of an adjacent component with red grids. The point denoted by P is the centroid of the cell closest to P in the component with red grids. The reconstruction formulation of a variable is first calculated in the stencil centred on a cell with its centroid denoted by P′ in the component with red grids and then transferred to the ghost cell with its centroid denoted by P in the component with blue grids.
Current usage metrics show cumulative count of Article Views (full-text article views including HTML views, PDF and ePub downloads, according to the available data) and Abstracts Views on Vision4Press platform.
Data correspond to usage on the plateform after 2015. The current usage metrics is available 48-96 hours after online publication and is updated daily on week days.
Initial download of the metrics may take a while.