Fig. 5
Download original image
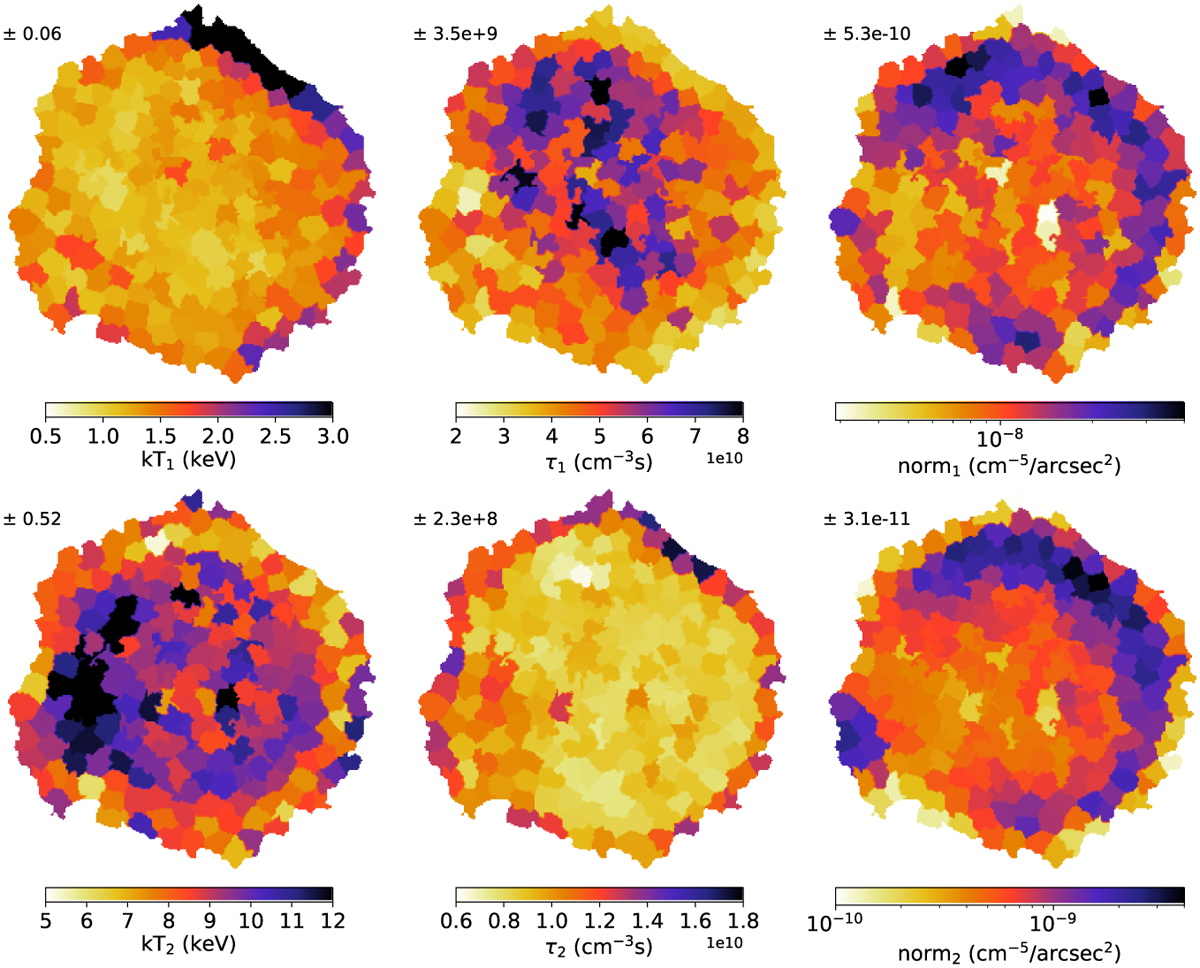
Maps of the main parameters of the two thermal components: temperature, ionisation time, and normalisation. The normalisation is the volume emission measure as defined by VNEI model divided by the region area. The top row corresponds to the VNEI 1 associated with the IMEs, the bottom one is the hotter VNEI 2 related to the iron-rich ejecta. The scales are not the same in both rows. The value in the upper-left of each map indicates the mean uncertainty (the median of the uncertainties over all regions)
Current usage metrics show cumulative count of Article Views (full-text article views including HTML views, PDF and ePub downloads, according to the available data) and Abstracts Views on Vision4Press platform.
Data correspond to usage on the plateform after 2015. The current usage metrics is available 48-96 hours after online publication and is updated daily on week days.
Initial download of the metrics may take a while.