Fig. 3
Download original image
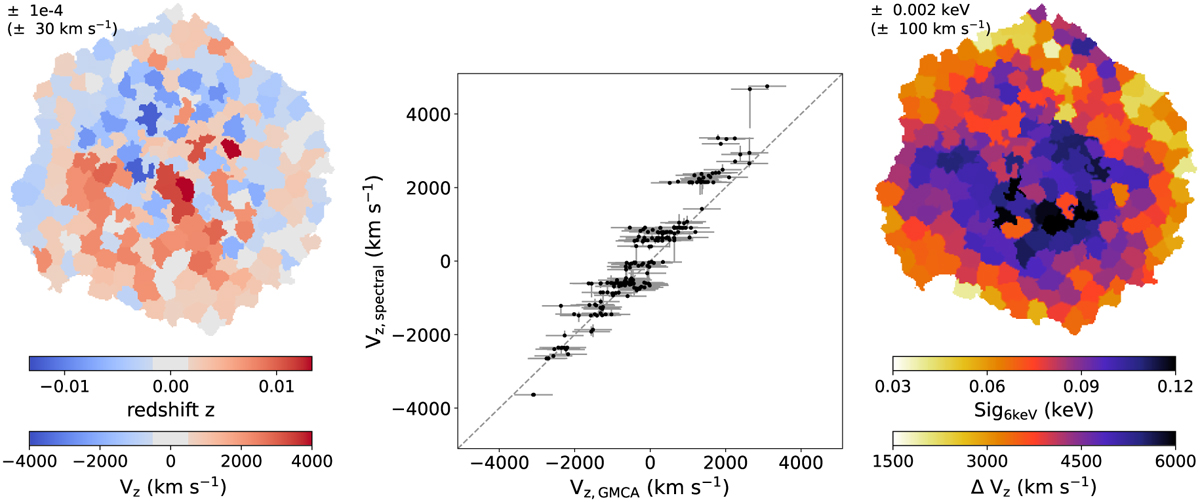
Obtained maps related to the dynamics of the SNR. Left: shocked ejecta velocity Vz from our Bayesian spectral study. The uncertainty (top left) only represents the statistical error. Middle: comparison for each region between the median of the velocity Vz in each region from the GMCA maps and the values obtained in this study with a Bayesian spectral fit. Right: Sig6keV parameter, which corresponds to the spectral Gaussian smoothing applied to all the ejecta components (first color bar) equivalent to shocked ejecta velocity dispersion ∆Vz (second color bar).
Current usage metrics show cumulative count of Article Views (full-text article views including HTML views, PDF and ePub downloads, according to the available data) and Abstracts Views on Vision4Press platform.
Data correspond to usage on the plateform after 2015. The current usage metrics is available 48-96 hours after online publication and is updated daily on week days.
Initial download of the metrics may take a while.