Fig. 2
Download original image
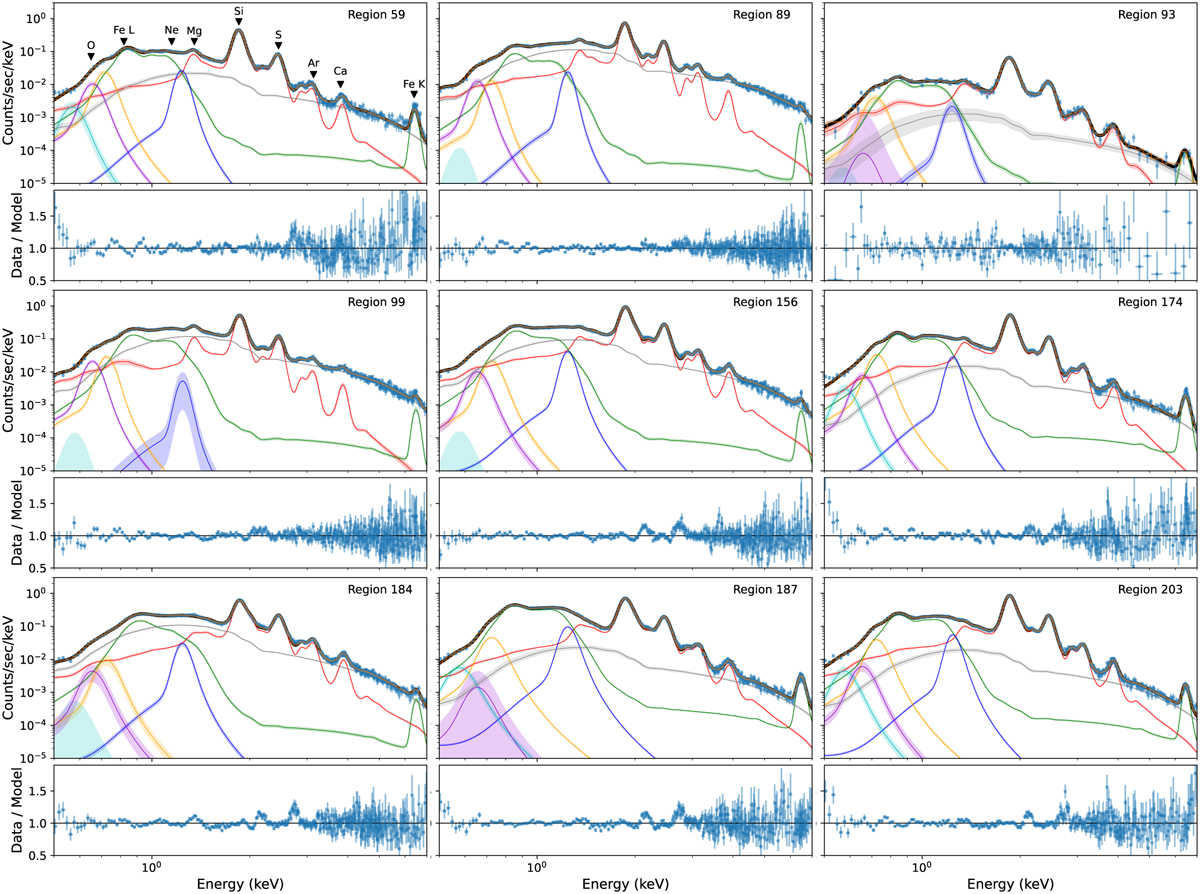
Examples for nine regions of spectra and best fits obtained with the Bayesian analysis framework BXA. Each component has its associated uncertainty band at 90% confidence level (hardly visible for the dominant components). The VNEI for the IMEs is in red, the hotter VNEI for the iron-rich ejecta in green, and the power law for the synchrotron emission in grey. The four Gaussian components are shown in blue (G1 at 1.24 keV), in yellow (G2 at 0.72 keV), in violet (G3 at 0.654 keV), and in cyan (G4 at 0.57 keV). The expected emission lines of elements are indicated on the first spectrum. The spectra of the nine Chandra observations are merged for visualisation purposes. The associated posterior corner plots for some of these regions are shown in Appendix C.
Current usage metrics show cumulative count of Article Views (full-text article views including HTML views, PDF and ePub downloads, according to the available data) and Abstracts Views on Vision4Press platform.
Data correspond to usage on the plateform after 2015. The current usage metrics is available 48-96 hours after online publication and is updated daily on week days.
Initial download of the metrics may take a while.