Fig. A.1
Download original image
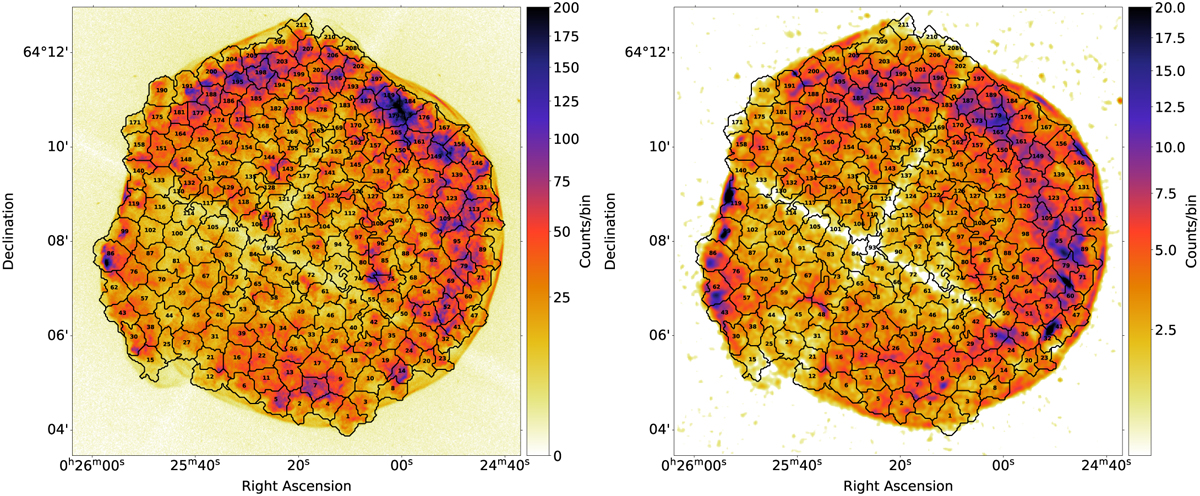
Segmentation used in this study compared to the image of Tycho’s SNR in different energy bands. The map is not corrected from the exposure map to highlight the diversity in counts across the regions. Left: Between 1.6 and 4.2 keV to highlight the IME emission (Si, S, Ar and Ca) with a bin size of 0.5” Right: Energy band between 5.8 and 7.1 keV, which represents the Fe-K emission with some contribution of the synchrotron emission with a bin size of 2” and a Gaussian smoothing with a kernel of 2”.
Current usage metrics show cumulative count of Article Views (full-text article views including HTML views, PDF and ePub downloads, according to the available data) and Abstracts Views on Vision4Press platform.
Data correspond to usage on the plateform after 2015. The current usage metrics is available 48-96 hours after online publication and is updated daily on week days.
Initial download of the metrics may take a while.