Fig. 13
Download original image
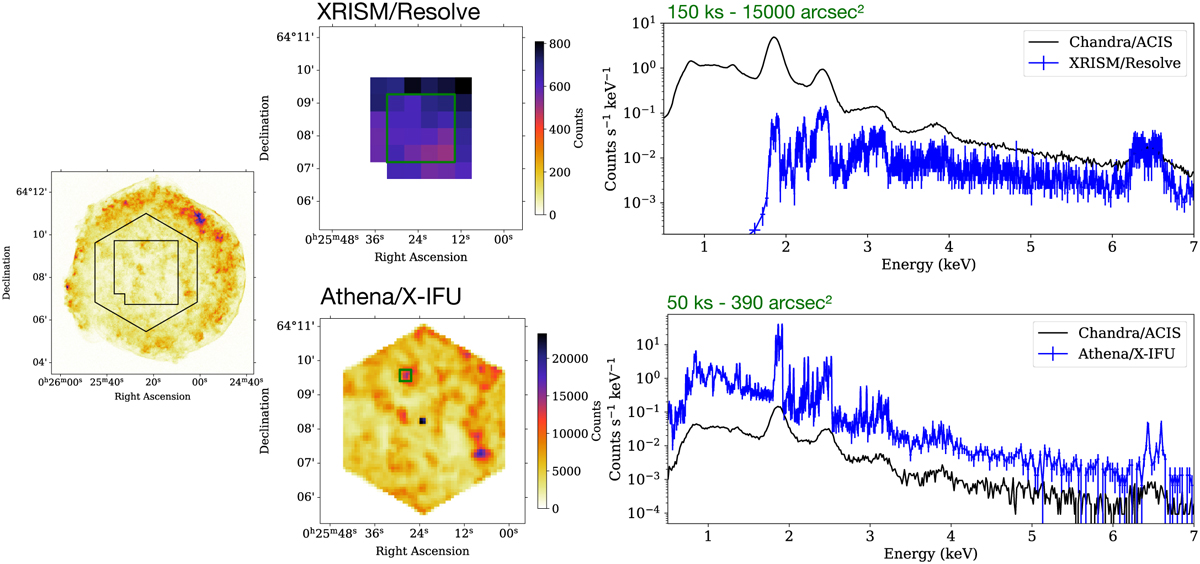
SIXTE simulations of the center of Tycho’s SNR based on the parameter mapping presented in this study. Left panel: flux image of Tycho’s SNR as observed by Chandra, corrected by the exposure map. We overlay the fields of view of the instruments XRISM/Resolve and Athena/X-IFU. Right upper panel: corresponding SIXTE image and spectrum simulation with XRISM/Resolve for 150 ks and the gate valve closed. The spectrum in blue is extracted from a region of 4×4 Resolve pixels (large green square in the XRISM image). Right lower panel: SIXTE image and spectrum simulation with Athena/X-IFU for 50 ks. The spectrum in blue is extracted from a 4×4 X-IFU pixels region (small green square in the Athena image). The XRISM/Resolve and Athena/X-IFU spectra have an adaptive rebinning to have at least 5 photons in each energy bin. We compare them with Chandra spectra (observations of 2009, 734 ks in total) extracted from the respective green regions.
Current usage metrics show cumulative count of Article Views (full-text article views including HTML views, PDF and ePub downloads, according to the available data) and Abstracts Views on Vision4Press platform.
Data correspond to usage on the plateform after 2015. The current usage metrics is available 48-96 hours after online publication and is updated daily on week days.
Initial download of the metrics may take a while.