Fig. A.2
Download original image
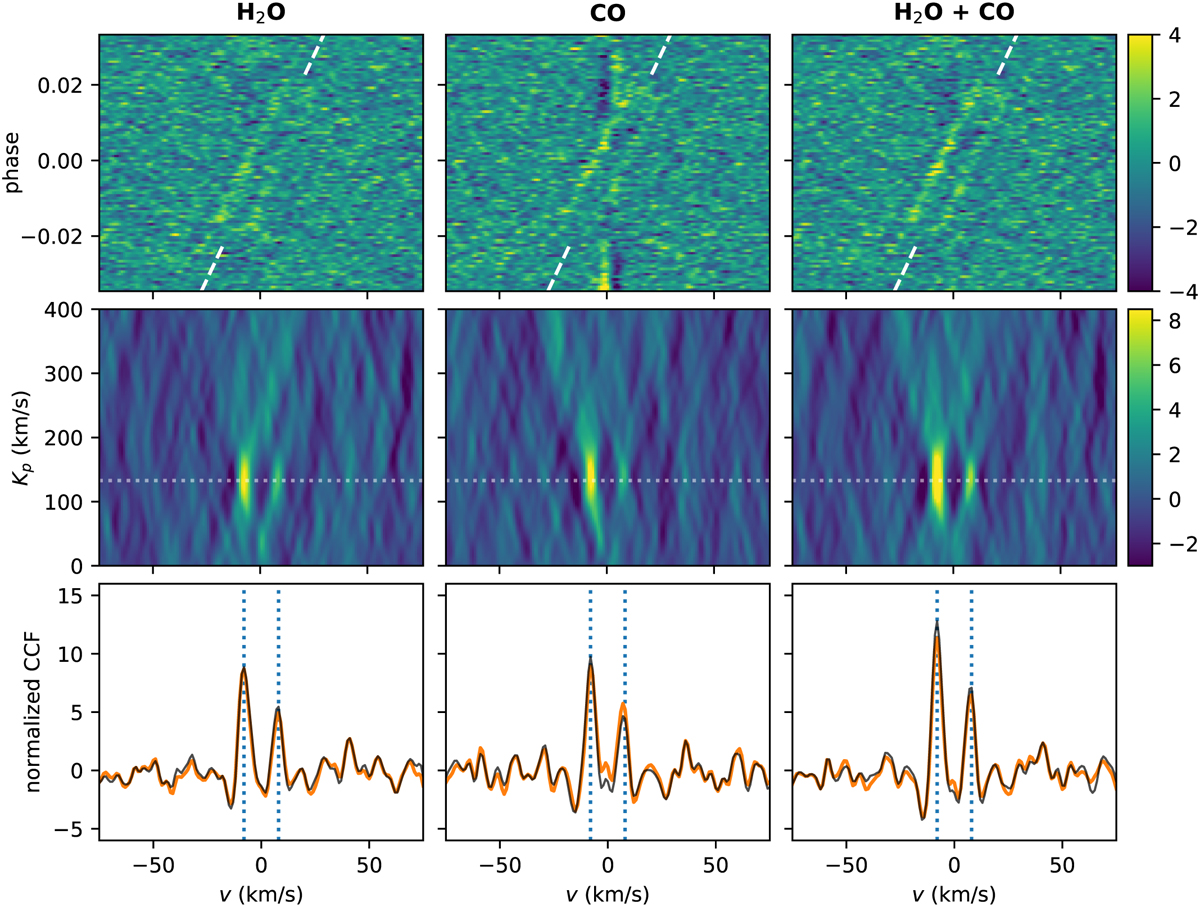
Results of the cross-correlation analysis for the data corrected by using SYSREM in telluric rest frame. Results are shown for cross-correlation with a pure H2O model (left column), a pure CO model (middle column) and for a model containing both atmospheric species (right column) in the same manner as in as Fig. 2, but with the analysis done in telluric rest frame instead of stellar rest frame. Top panel: cross-correlation function for each orbital phase. For the CO case, the residual noise from stellar lines can be seen in the form of vertical structures. The radial velocity of the planetary orbital motion is indicated with a white dashed line. Middle panel: Kp-v map, i.e. the CCF co-added using different values for Kp. The white dotted line indicates the value for Kp found in the literature. Bottom panel: cut through the Kp-v map at the literature Kp value (black solid lines). The curves resulting from the analysis performed in stellar rest frame, which are shown in Fig. 2, are overplotted (orange solid lines) to facilitate comparison between the CCFs resulting from the two different approaches.
Current usage metrics show cumulative count of Article Views (full-text article views including HTML views, PDF and ePub downloads, according to the available data) and Abstracts Views on Vision4Press platform.
Data correspond to usage on the plateform after 2015. The current usage metrics is available 48-96 hours after online publication and is updated daily on week days.
Initial download of the metrics may take a while.