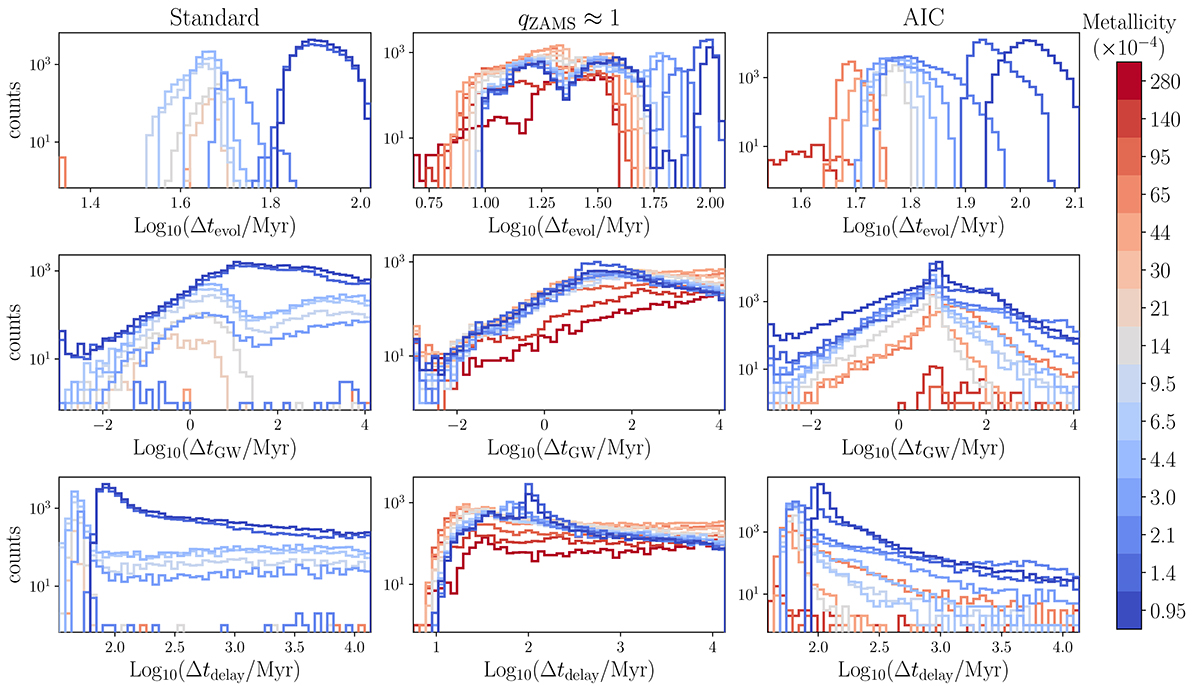
Fig. 9.
Download original image
Distribution of the properties of the population of BNS at their formation (i.e. right after the secondary SN) for the standard evolutionary track (left), the equal-mass track (centre), and the AIC track (right). Each colour represents the population at one of the sampled metallicity values. From top to bottom, the three rows show the distributions of (1) stellar evolution times, (2) merger times, and (3) delay times.
Current usage metrics show cumulative count of Article Views (full-text article views including HTML views, PDF and ePub downloads, according to the available data) and Abstracts Views on Vision4Press platform.
Data correspond to usage on the plateform after 2015. The current usage metrics is available 48-96 hours after online publication and is updated daily on week days.
Initial download of the metrics may take a while.