Fig. 8.
Download original image
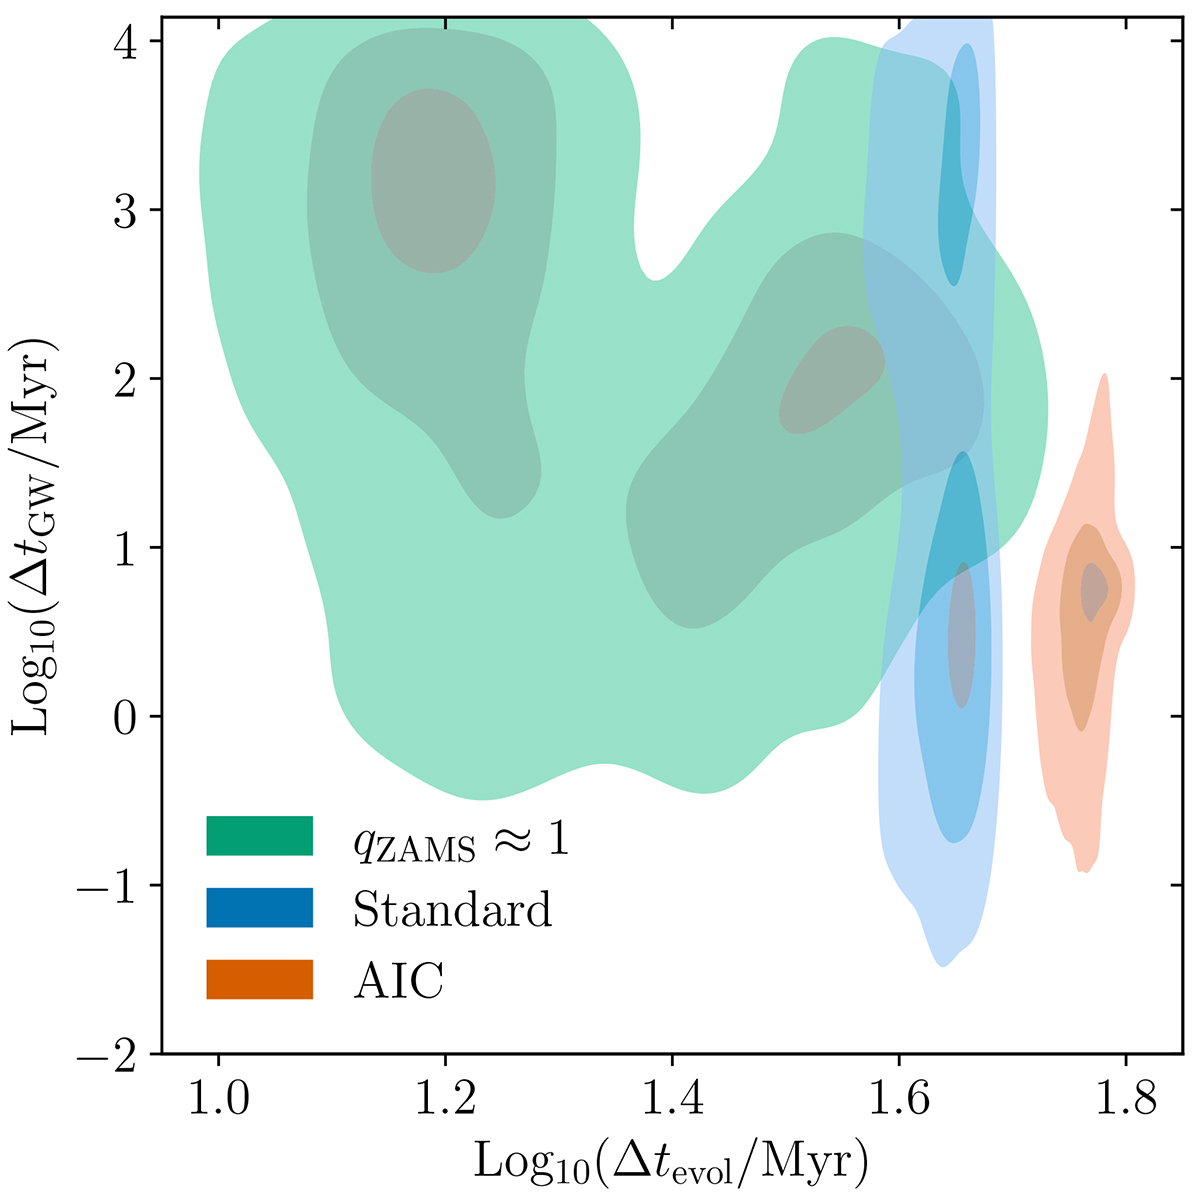
Correlation between the formation and merger times for the three evolutionary tracks at Z = 9.5 × 10⁻⁴ and for systems with Δtdelay < tHubble. The three tracks are found on distinct regions of the plane, as discussed in Sect. 3.3. The shaded contours represent the smallest regions containing 10%, 50%, and 90% of the systems.
Current usage metrics show cumulative count of Article Views (full-text article views including HTML views, PDF and ePub downloads, according to the available data) and Abstracts Views on Vision4Press platform.
Data correspond to usage on the plateform after 2015. The current usage metrics is available 48-96 hours after online publication and is updated daily on week days.
Initial download of the metrics may take a while.