Fig. 2.
Download original image
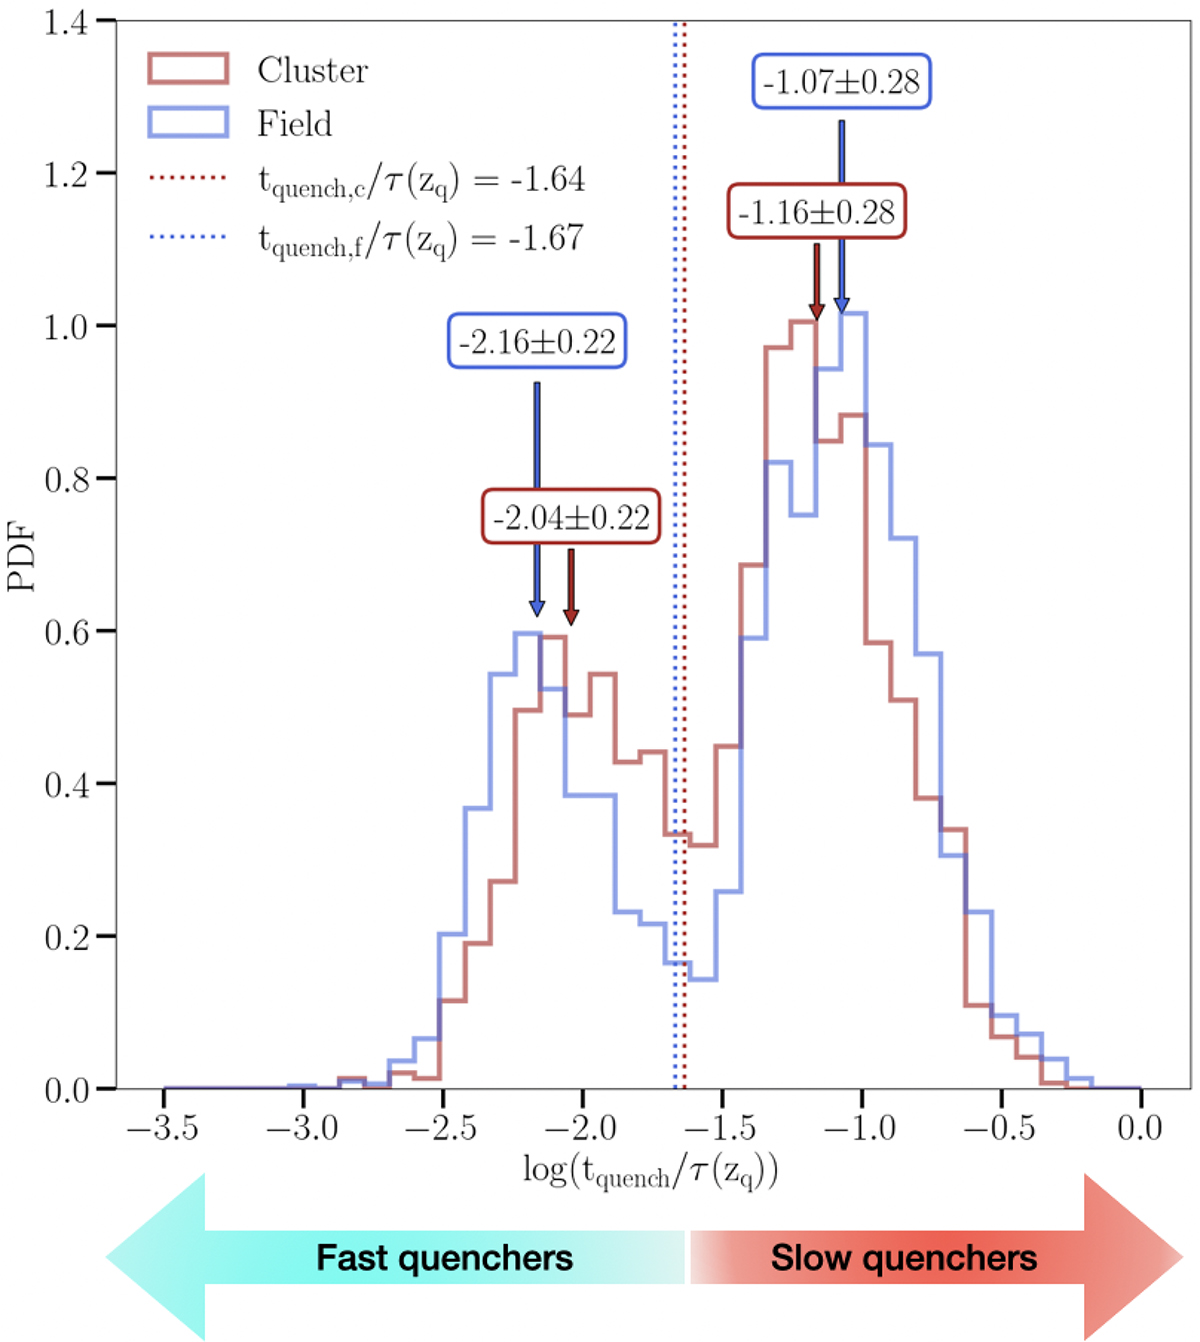
PDF distribution of the normalised quenching time for cluster (dark red) and field (blue) galaxies. The quenching time tquench is divided by the cosmic time τ(zq) at the redshift zq at which the galaxy starts quenching. The vertical dotted dark red(blue) line represents the log(tquench/τ(zq)) = −1.64(−1.67) separation between fast and slow quenching galaxies in cluster(field).
Current usage metrics show cumulative count of Article Views (full-text article views including HTML views, PDF and ePub downloads, according to the available data) and Abstracts Views on Vision4Press platform.
Data correspond to usage on the plateform after 2015. The current usage metrics is available 48-96 hours after online publication and is updated daily on week days.
Initial download of the metrics may take a while.