Fig. 6
Download original image
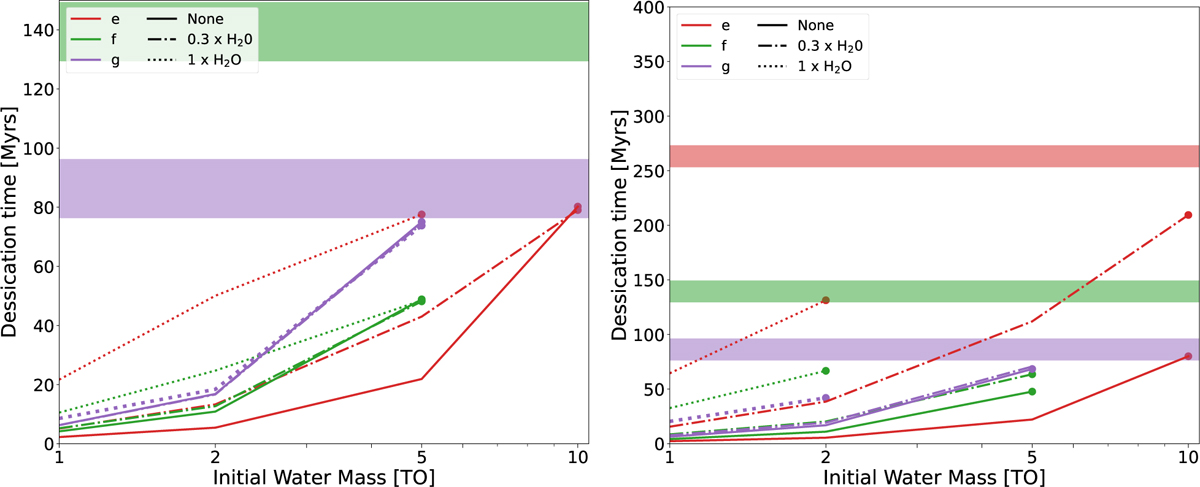
Overview of total atmospheric desiccation times of TRAPPIST-1 e (red), f (green) and g (purple) for a dry composition with 1–10 TO of initial H2O, assuming an albedo of 0.75 (left) and 0 (right). Colored shaded regions denote the time, when the respective planet enters the habitable zone. Solid lines represent scenario with pure H2O atmospheres, dash-dotted lines denote scenarios with added CO2 scaled by 0.3x compared to the initial H2O mass, and dotted lines show scenarios with added CO2 equal to the initial water mass. The solid circles denote for a given H2O-CO2 mass fraction and planet the maximum initial water mass, for which total atmosphere desiccation occurs before the respective planet enters the habitable zone. Please note the change in y-axis scale between the plots.
Current usage metrics show cumulative count of Article Views (full-text article views including HTML views, PDF and ePub downloads, according to the available data) and Abstracts Views on Vision4Press platform.
Data correspond to usage on the plateform after 2015. The current usage metrics is available 48-96 hours after online publication and is updated daily on week days.
Initial download of the metrics may take a while.