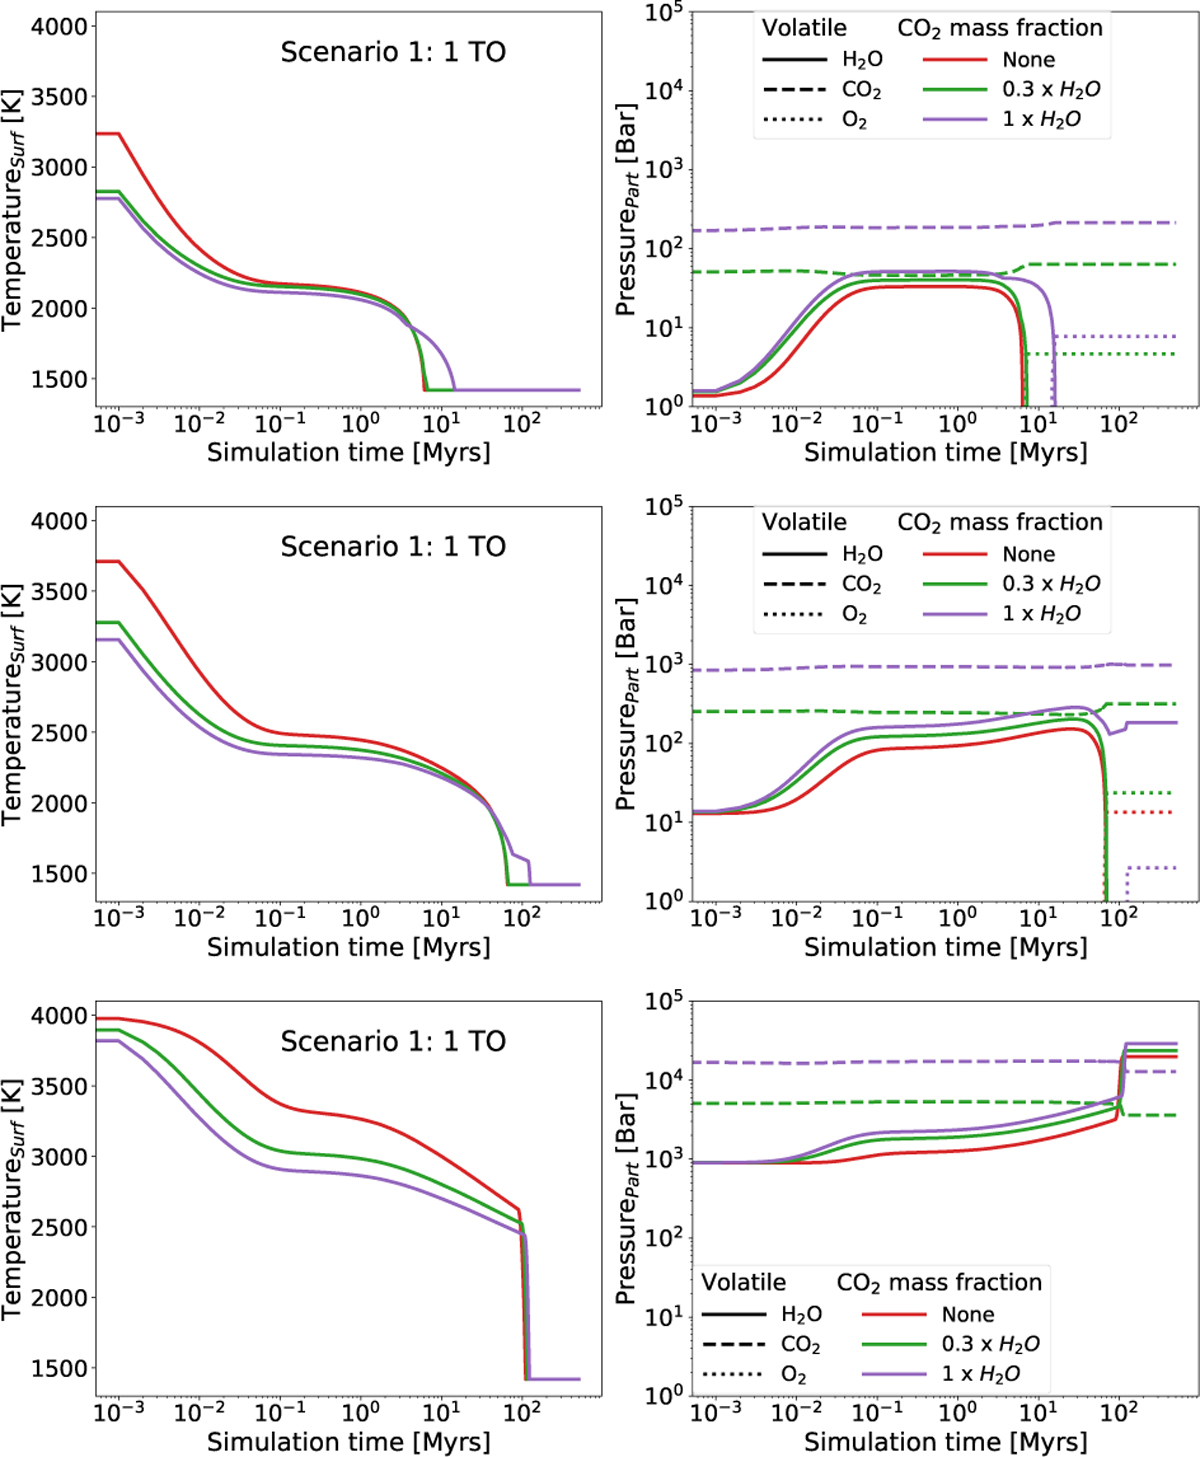
Fig. 4
Download original image
Magma ocean evolution for initial H2O of 1 TO, 5 TO, and 100 TO , respectively. All scenarios are for albedo=0. Initial CO2 mass content is scaled relative to the H2O content by a factor of 0, 0.3, and 1, denoted by red, green, and purple lines, respectively. Surface temperature (left) and volatile content evolution (right) are shown.H2O, CO2, and O2 are denoted by solid, dashed, and dotted lines, respectively.
Current usage metrics show cumulative count of Article Views (full-text article views including HTML views, PDF and ePub downloads, according to the available data) and Abstracts Views on Vision4Press platform.
Data correspond to usage on the plateform after 2015. The current usage metrics is available 48-96 hours after online publication and is updated daily on week days.
Initial download of the metrics may take a while.