Fig. D.3
Download original image
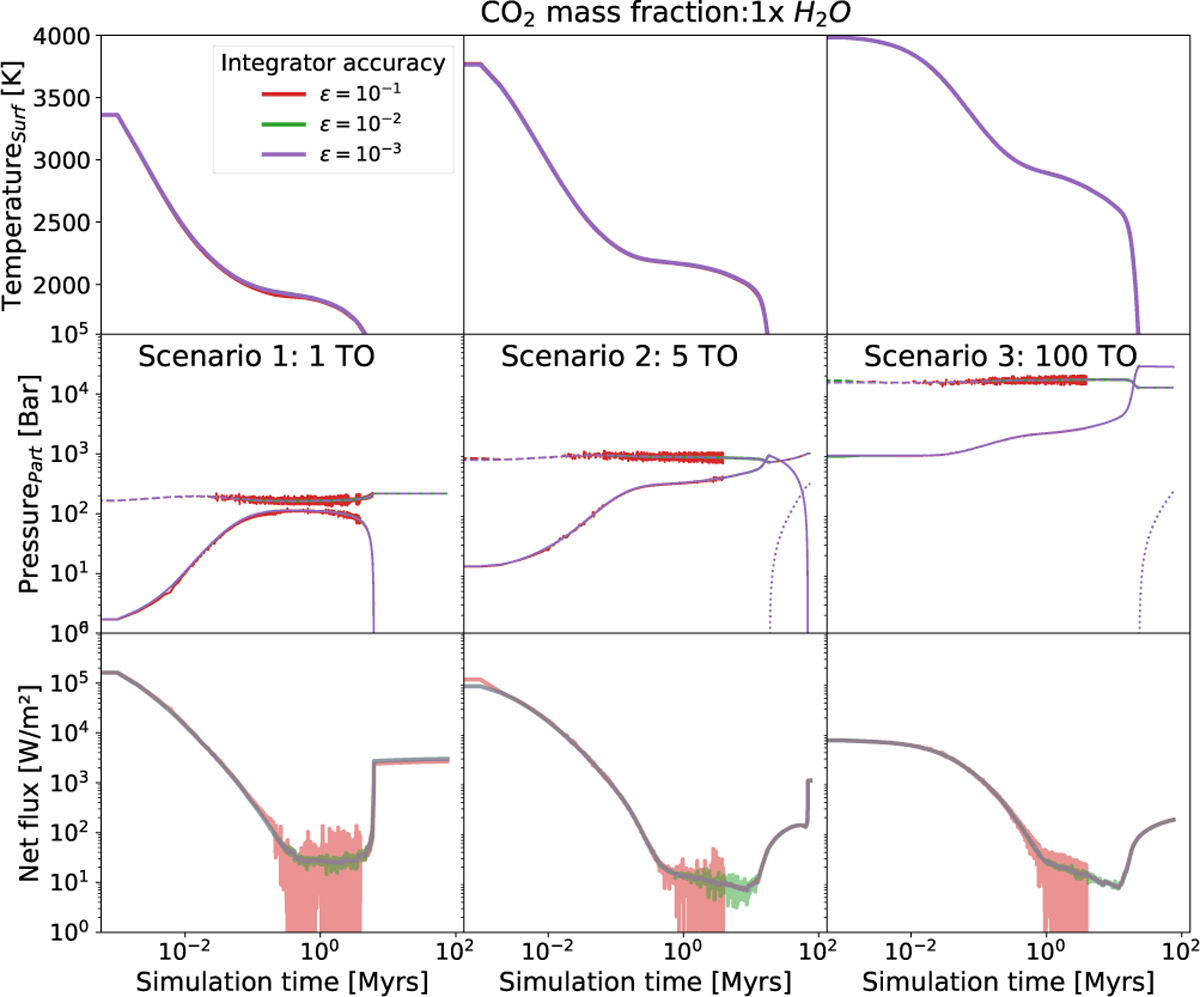
TRAPPIST-1 g magma ocean evolution with different relative accuracies ϵ in the integration during runtime for additional Co2, the mass of which is scaled by a factor of 1 with the initial H2O masses in the system (red: ϵ = 10–1, green: ϵ = 10–2, purple: ϵ = 10–3). Top panels show surface temperatures, middle panels show volatile partial pressures (solid: H2O, dashed: CO2 dotted: O2), bottom panels show net flux for initial water masses of 1 TO, 5 TO, and 100 TO from left to right.
Current usage metrics show cumulative count of Article Views (full-text article views including HTML views, PDF and ePub downloads, according to the available data) and Abstracts Views on Vision4Press platform.
Data correspond to usage on the plateform after 2015. The current usage metrics is available 48-96 hours after online publication and is updated daily on week days.
Initial download of the metrics may take a while.