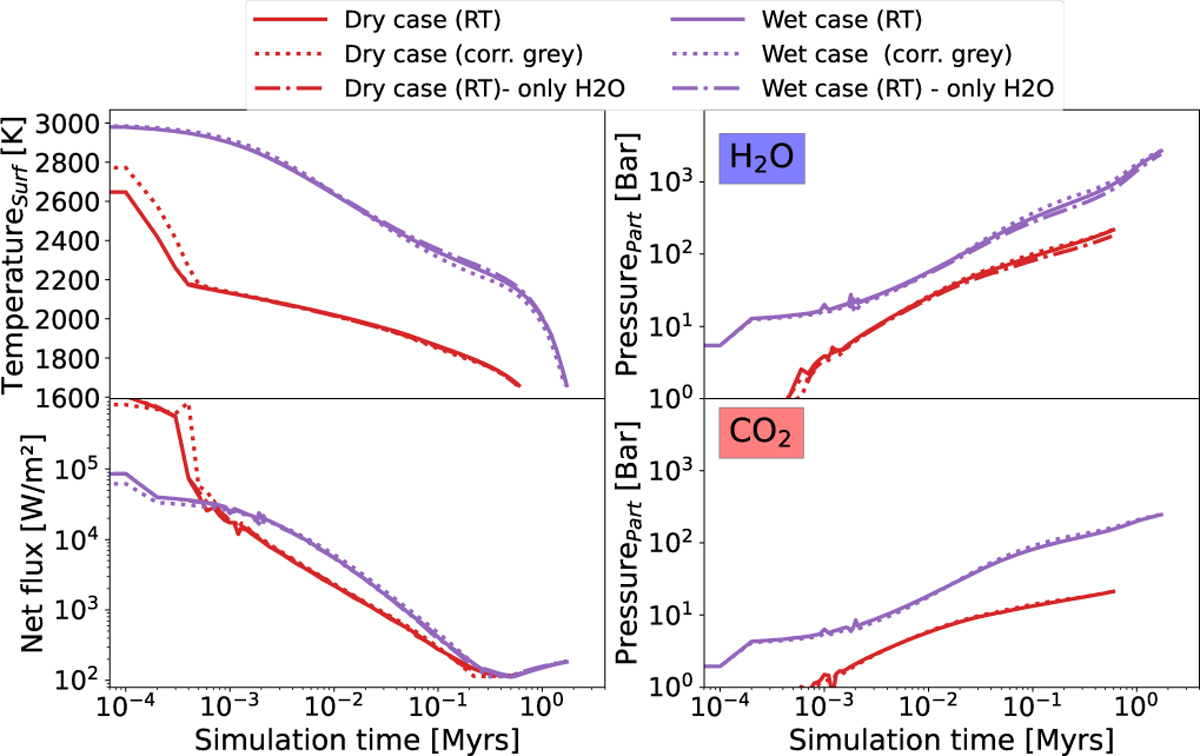
Fig. C.5
Download original image
Earth magma ocean simulation for comparison with Elkins-Tanton (2008) with the corrected gray and full RT atmosphere model. Scenarios are as listed in Table C.1. The dotted lines denote results of simulations with the corrected gray atmosphere model. Solid lines denote results of simulations with full RT. The dash-dotted line denote the results of simulations with full RT only with H2O to assess the impact of CO2.
Current usage metrics show cumulative count of Article Views (full-text article views including HTML views, PDF and ePub downloads, according to the available data) and Abstracts Views on Vision4Press platform.
Data correspond to usage on the plateform after 2015. The current usage metrics is available 48-96 hours after online publication and is updated daily on week days.
Initial download of the metrics may take a while.