Fig. 2
Download original image
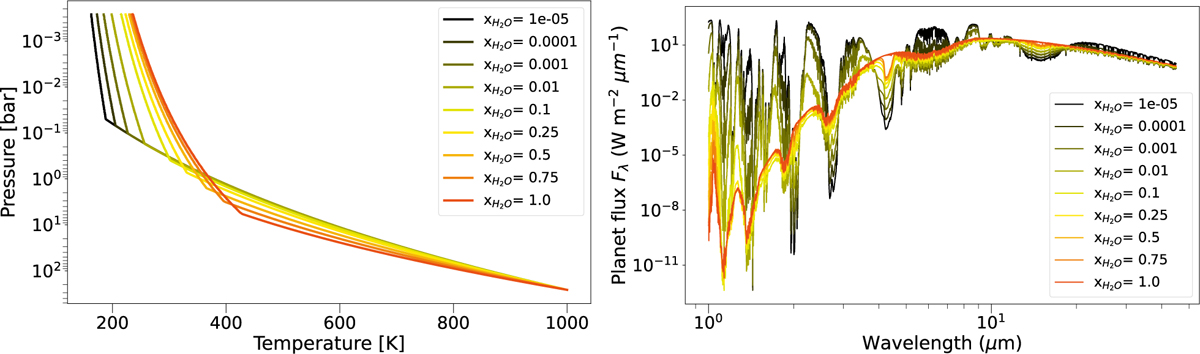
Vertically extended pressure-temperature (pgas, Tgas) profiles for psur f = 260 bar and Tsur f = 1000 K and different water mixing ratios, ![]() (left). The solid black and solid red line denote 100% CO2 and 100% H2O atmosphere composition, respectively. The profiles converge in the upper atmosphere to the condensation curve, where we assume equilibrium between condensation and evaporation of H2O and CO2 (supersaturation ratio S = 1). Change in emission (right) from a pure H2O atmosphere (red line) to CO2-dominated (black line).
(left). The solid black and solid red line denote 100% CO2 and 100% H2O atmosphere composition, respectively. The profiles converge in the upper atmosphere to the condensation curve, where we assume equilibrium between condensation and evaporation of H2O and CO2 (supersaturation ratio S = 1). Change in emission (right) from a pure H2O atmosphere (red line) to CO2-dominated (black line).
Current usage metrics show cumulative count of Article Views (full-text article views including HTML views, PDF and ePub downloads, according to the available data) and Abstracts Views on Vision4Press platform.
Data correspond to usage on the plateform after 2015. The current usage metrics is available 48-96 hours after online publication and is updated daily on week days.
Initial download of the metrics may take a while.