Fig. C.3
Download original image
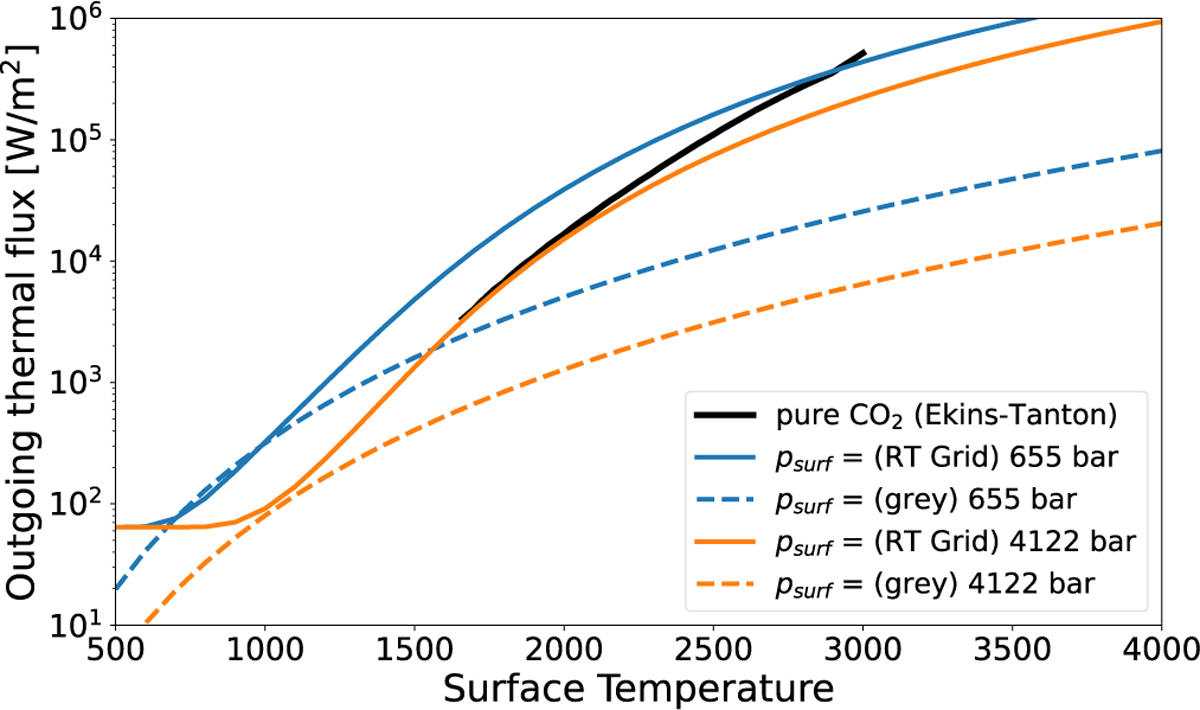
Pure CO2 Earth magma ocean simulation with 14.7 TO of initial CO2 mass following Elkins-Tanton (2008) and using the RT atmosphere model (solid black line). Two RT thermal emission grid lines for psurf = 655 bar (blue solid line) and psurf = 4122 bar (orange solid line) are shown, respectively, as specified in Sect. 2.5. The corresponding thermal emission for the gray atmosphere model as used in Elkins-Tanton (2008) is shown for comparison (dashed lines). The thermal emission deviates between the RT and gray atmosphere model by up to two orders of magnitude during the magma ocean stage in this case with Tsurf = 1500-3000 K.
Current usage metrics show cumulative count of Article Views (full-text article views including HTML views, PDF and ePub downloads, according to the available data) and Abstracts Views on Vision4Press platform.
Data correspond to usage on the plateform after 2015. The current usage metrics is available 48-96 hours after online publication and is updated daily on week days.
Initial download of the metrics may take a while.