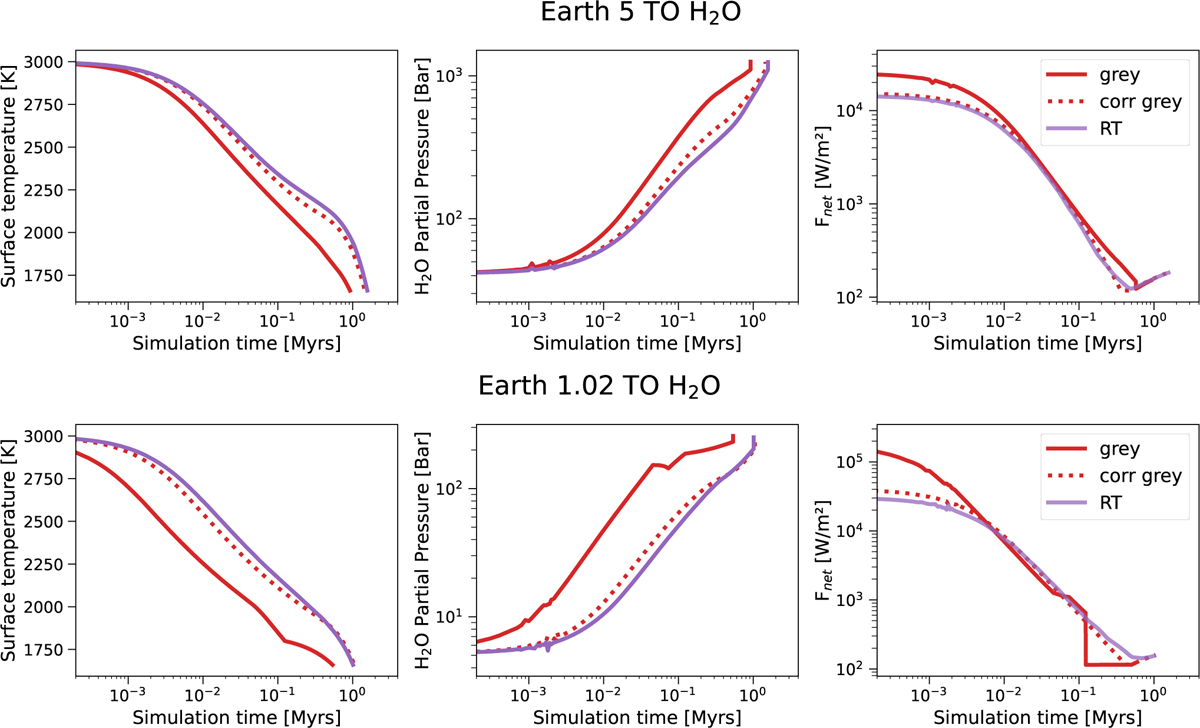
Fig. C.1
Download original image
MagmOc2.0 simulations for Earth and an initial water content of 5 TO (top panel) and 1.02 TO (bottom panel). Depicted from left to right in each panel are: Surface temperature, H2O atmosphere surface pressure and net flux at the top of the atmosphere (FOLR − FASR). Three different atmosphere models are used: The gray atmosphere model (solid red line), the corrected gray model (dotted red line), and the RT model (solid purple line).
Current usage metrics show cumulative count of Article Views (full-text article views including HTML views, PDF and ePub downloads, according to the available data) and Abstracts Views on Vision4Press platform.
Data correspond to usage on the plateform after 2015. The current usage metrics is available 48-96 hours after online publication and is updated daily on week days.
Initial download of the metrics may take a while.