Fig. B.2
Download original image
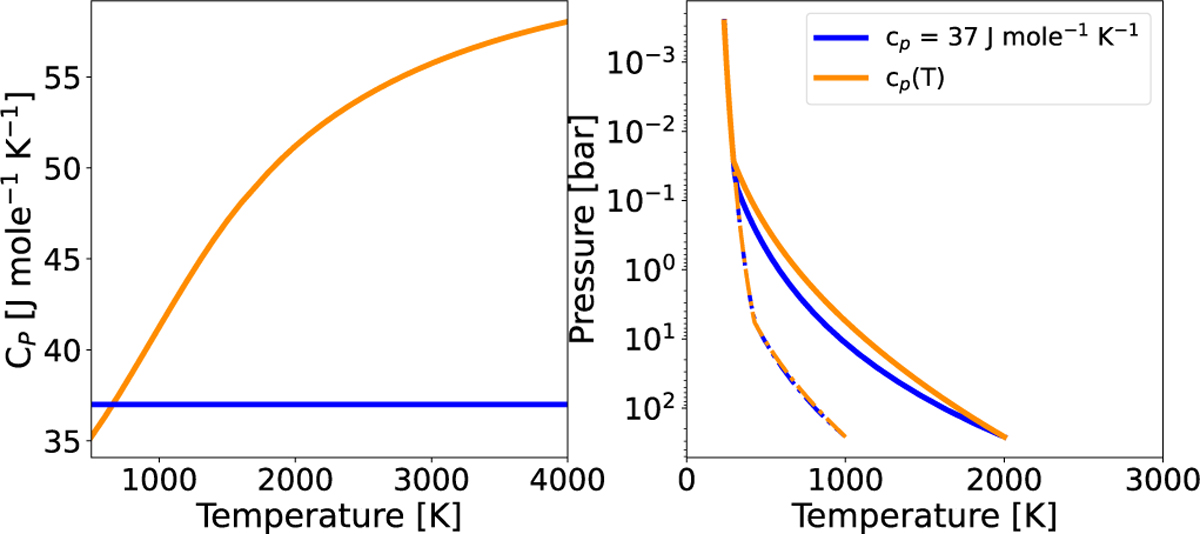
Left: Specific heat capacity versus temperature for constant cP (blue) and cP(T) (dark orange). Right: H2O pressure-temperature profiles for psurf = 260 bar and Tsurf = 1000 K (dash-dotted) and 2000 K (solid). Profiles assuming constant cP are shown in blue and profiles assuming temperature dependent cP are shown in dark orange. Note that for a 1000 K surface, the difference between the profiles is negligible.
Current usage metrics show cumulative count of Article Views (full-text article views including HTML views, PDF and ePub downloads, according to the available data) and Abstracts Views on Vision4Press platform.
Data correspond to usage on the plateform after 2015. The current usage metrics is available 48-96 hours after online publication and is updated daily on week days.
Initial download of the metrics may take a while.