Fig. 4.
Download original image
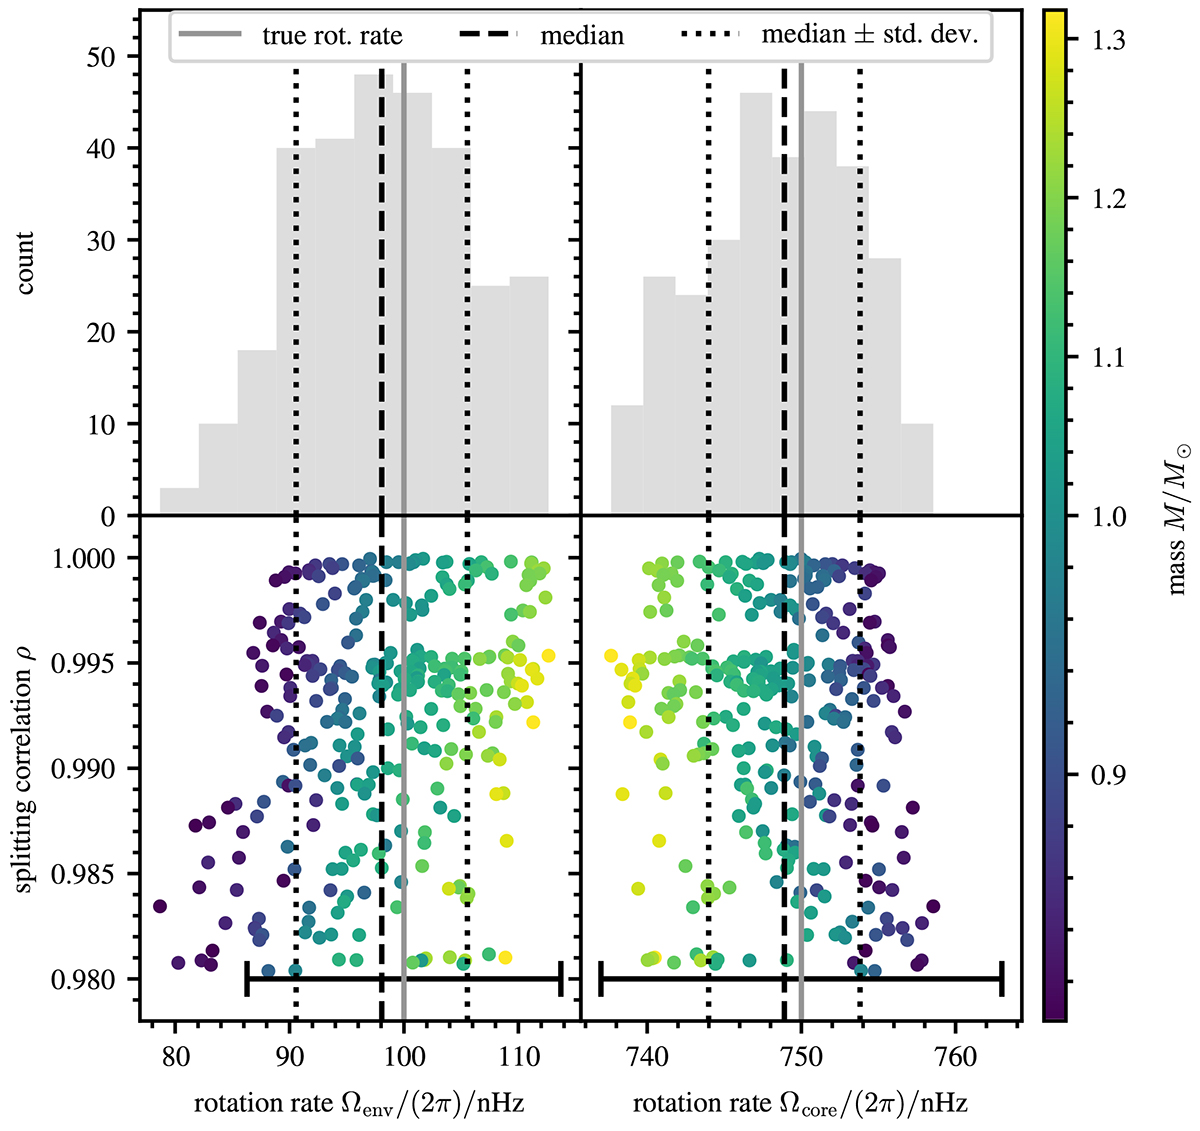
Estimated core and envelope rotation rates for the ensemble of reference models together with the associated correlation coefficients. Upper panels: Histogram of the estimated envelope and core rotation rates in the left and right panels, respectively. The grey line indicates the input value used to compute the synthetic rotational splittings, the black dashed line indicates the median value, and the black dotted line indicates ± one standard deviation from the median. Lower panels: Splitting correlation, ρ, as a function of the estimated envelope and core rotation rate. A threshold of ρthresh = 0.98 was used here. The vertical lines have the same meaning as in the upper panel. The error bar indicates the maximal random error across all rotational inversion results selected.
Current usage metrics show cumulative count of Article Views (full-text article views including HTML views, PDF and ePub downloads, according to the available data) and Abstracts Views on Vision4Press platform.
Data correspond to usage on the plateform after 2015. The current usage metrics is available 48-96 hours after online publication and is updated daily on week days.
Initial download of the metrics may take a while.