Fig. D.4.
Download original image
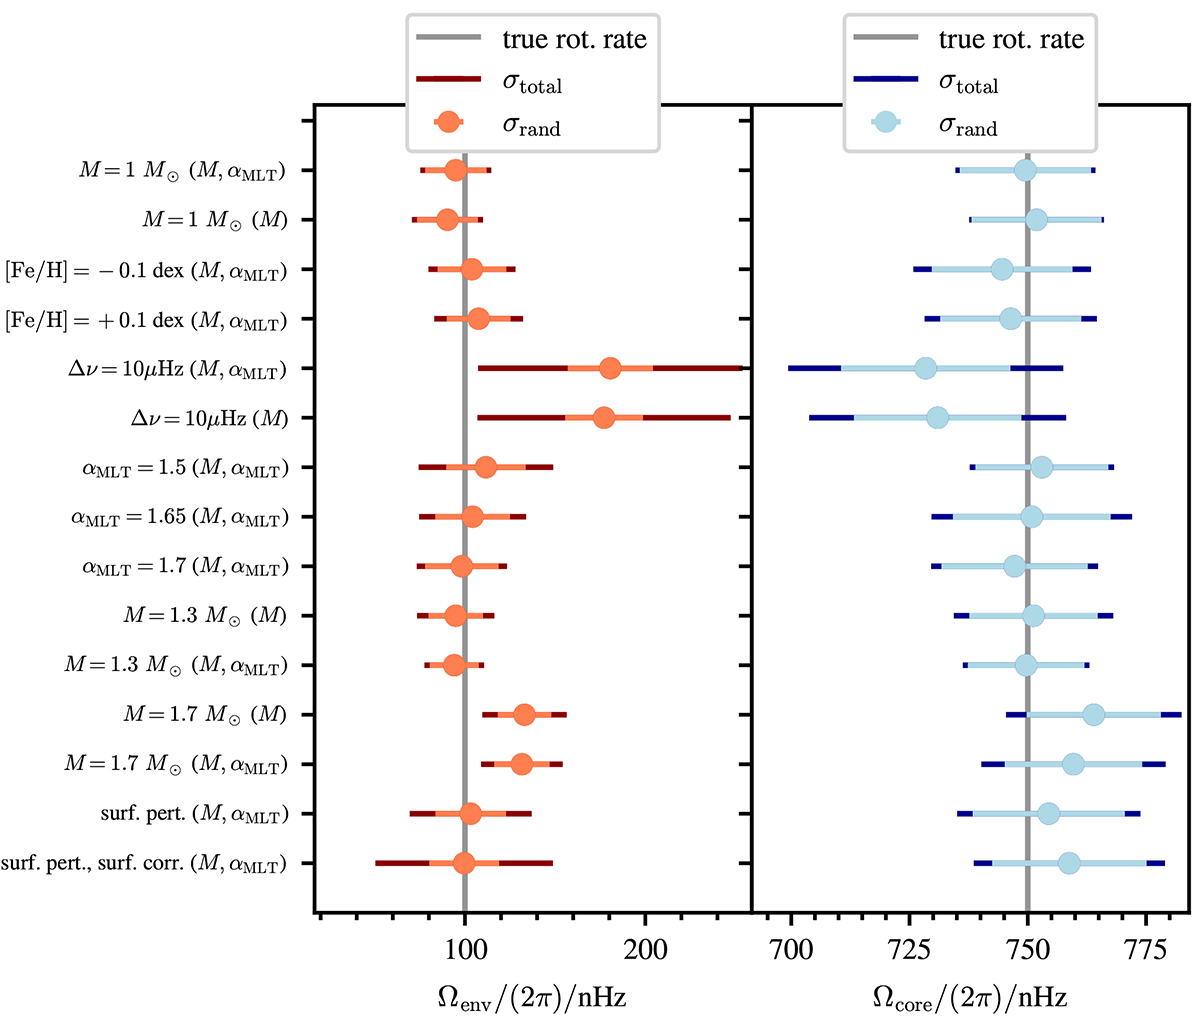
Ensemble inversion results for envelope (left) and core (right) rotation rates for different synthetic observations and using χdip2 only as a metric. The numerical values are summarised in Table D.2. The error given in the dark colours in each panel is calculated from the random and systematic errors in Table D.2 by error propagation: ![]() . The error bar in the light colours is representing the contribution of the random error σrand alone. The synthetic observation according to Table 1 is given as the x-axis label. The vertical grey lines indicate the input values.
. The error bar in the light colours is representing the contribution of the random error σrand alone. The synthetic observation according to Table 1 is given as the x-axis label. The vertical grey lines indicate the input values.
Current usage metrics show cumulative count of Article Views (full-text article views including HTML views, PDF and ePub downloads, according to the available data) and Abstracts Views on Vision4Press platform.
Data correspond to usage on the plateform after 2015. The current usage metrics is available 48-96 hours after online publication and is updated daily on week days.
Initial download of the metrics may take a while.