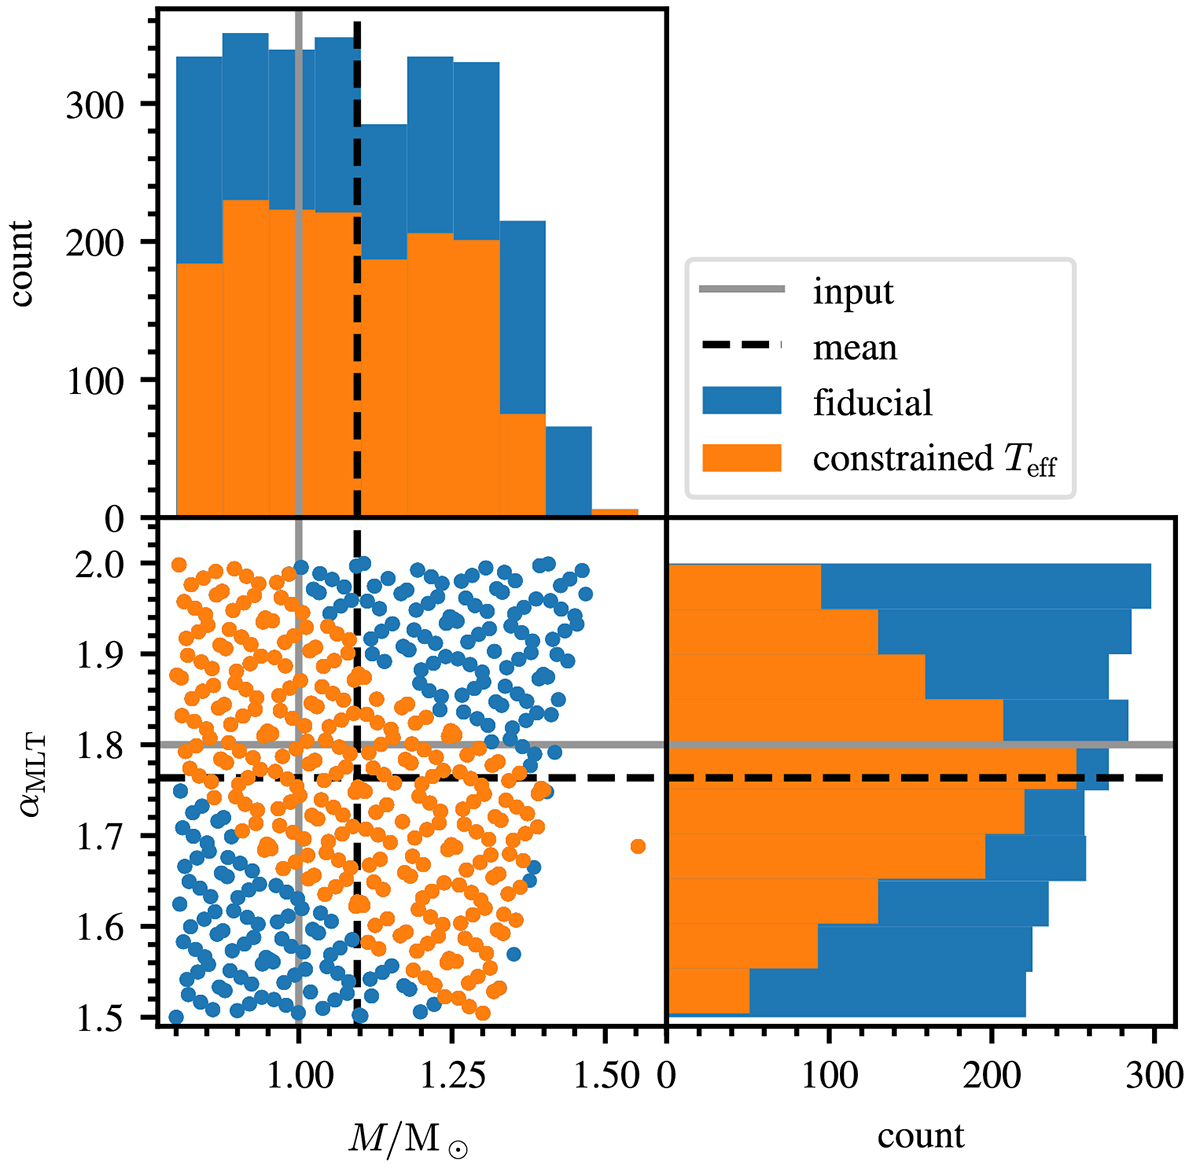
Fig. D.1.
Download original image
Mass and mixing-length parameter of selected reference models for different observational constraints. Upper left: Distribution of initial stellar masses for reference models selected based on global stellar properties and radial mode frequencies. The result for the fiducial model is shown in blue while the result including a constraint on the effective temperature is shown in orange. Lower right: Distribution of mixing-length parameters for selected models. Lower left: Scatter plot showing the mixing-length parameters versus the initial stellar mass for selected stellar models. The stellar models were selected following the selection process described in Appendix D.1 and D.2 (blue points). Results including a limit on Teff of ±100 K around the observed value using the fiducial model are shown in orange. The models were selected from the M, αMLT-grid. The grey lines and the black dashed lines refer to the input and the actual mean value of the blue distribution, respectively.
Current usage metrics show cumulative count of Article Views (full-text article views including HTML views, PDF and ePub downloads, according to the available data) and Abstracts Views on Vision4Press platform.
Data correspond to usage on the plateform after 2015. The current usage metrics is available 48-96 hours after online publication and is updated daily on week days.
Initial download of the metrics may take a while.