Open Access
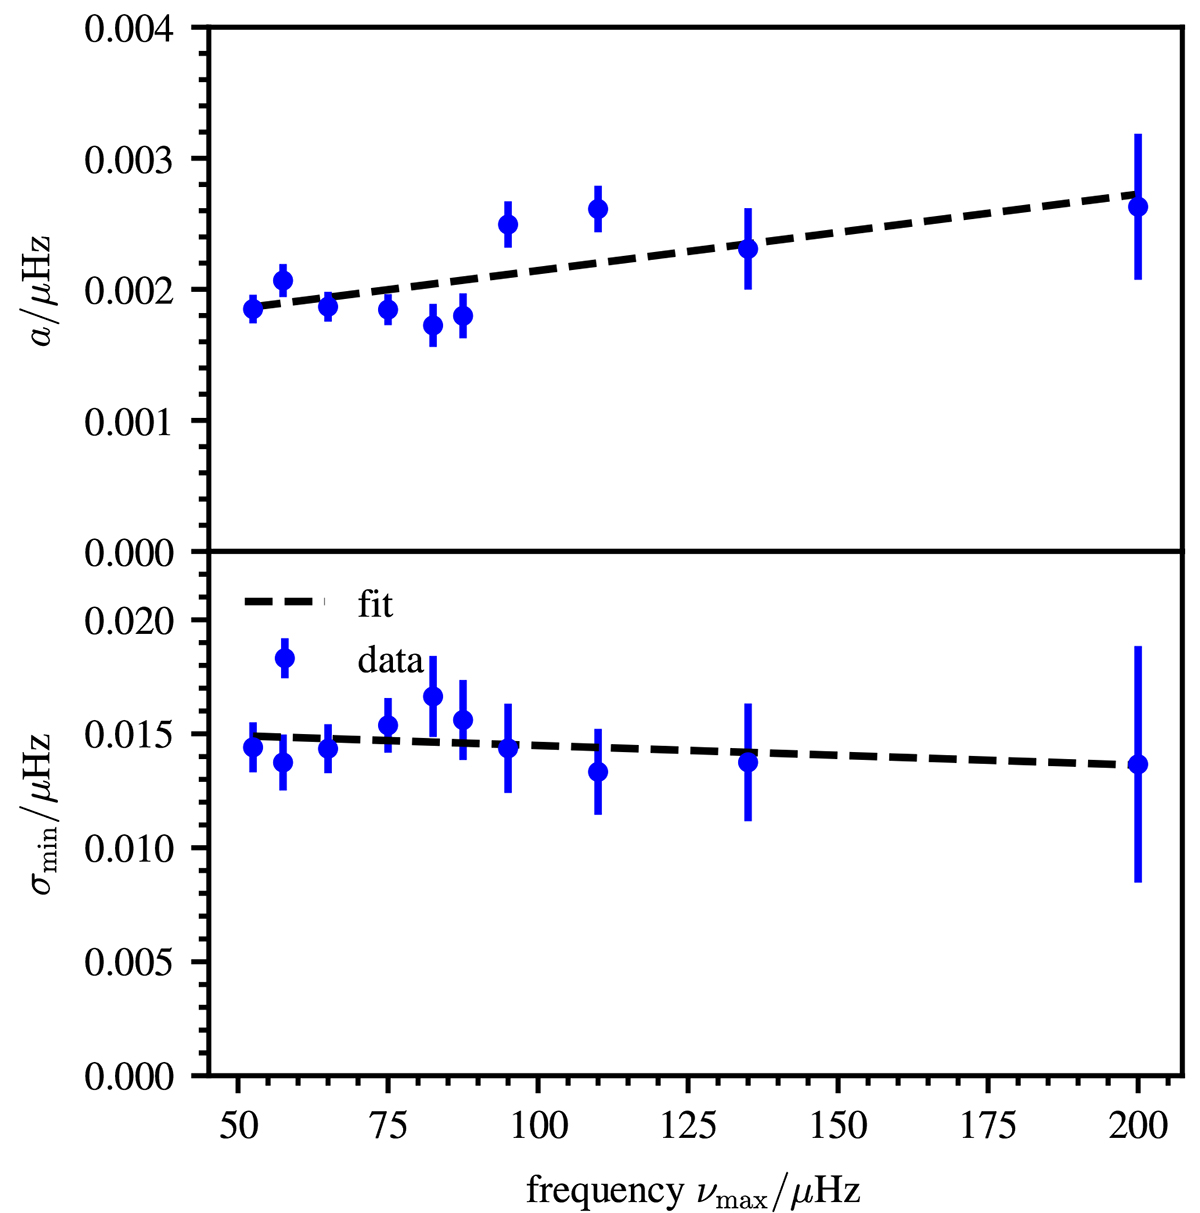
Fig. C.1.
Download original image
Values obtained for the parameters a and σmin as a function of νmax shown with blue points in the upper and lower panel, respectively. The error bars are obtained from the least squares fit to the uncertainties in the individual νmax bins. A linear fit to the data is shown with a black dashed line.
Current usage metrics show cumulative count of Article Views (full-text article views including HTML views, PDF and ePub downloads, according to the available data) and Abstracts Views on Vision4Press platform.
Data correspond to usage on the plateform after 2015. The current usage metrics is available 48-96 hours after online publication and is updated daily on week days.
Initial download of the metrics may take a while.