Fig. 8
Download original image
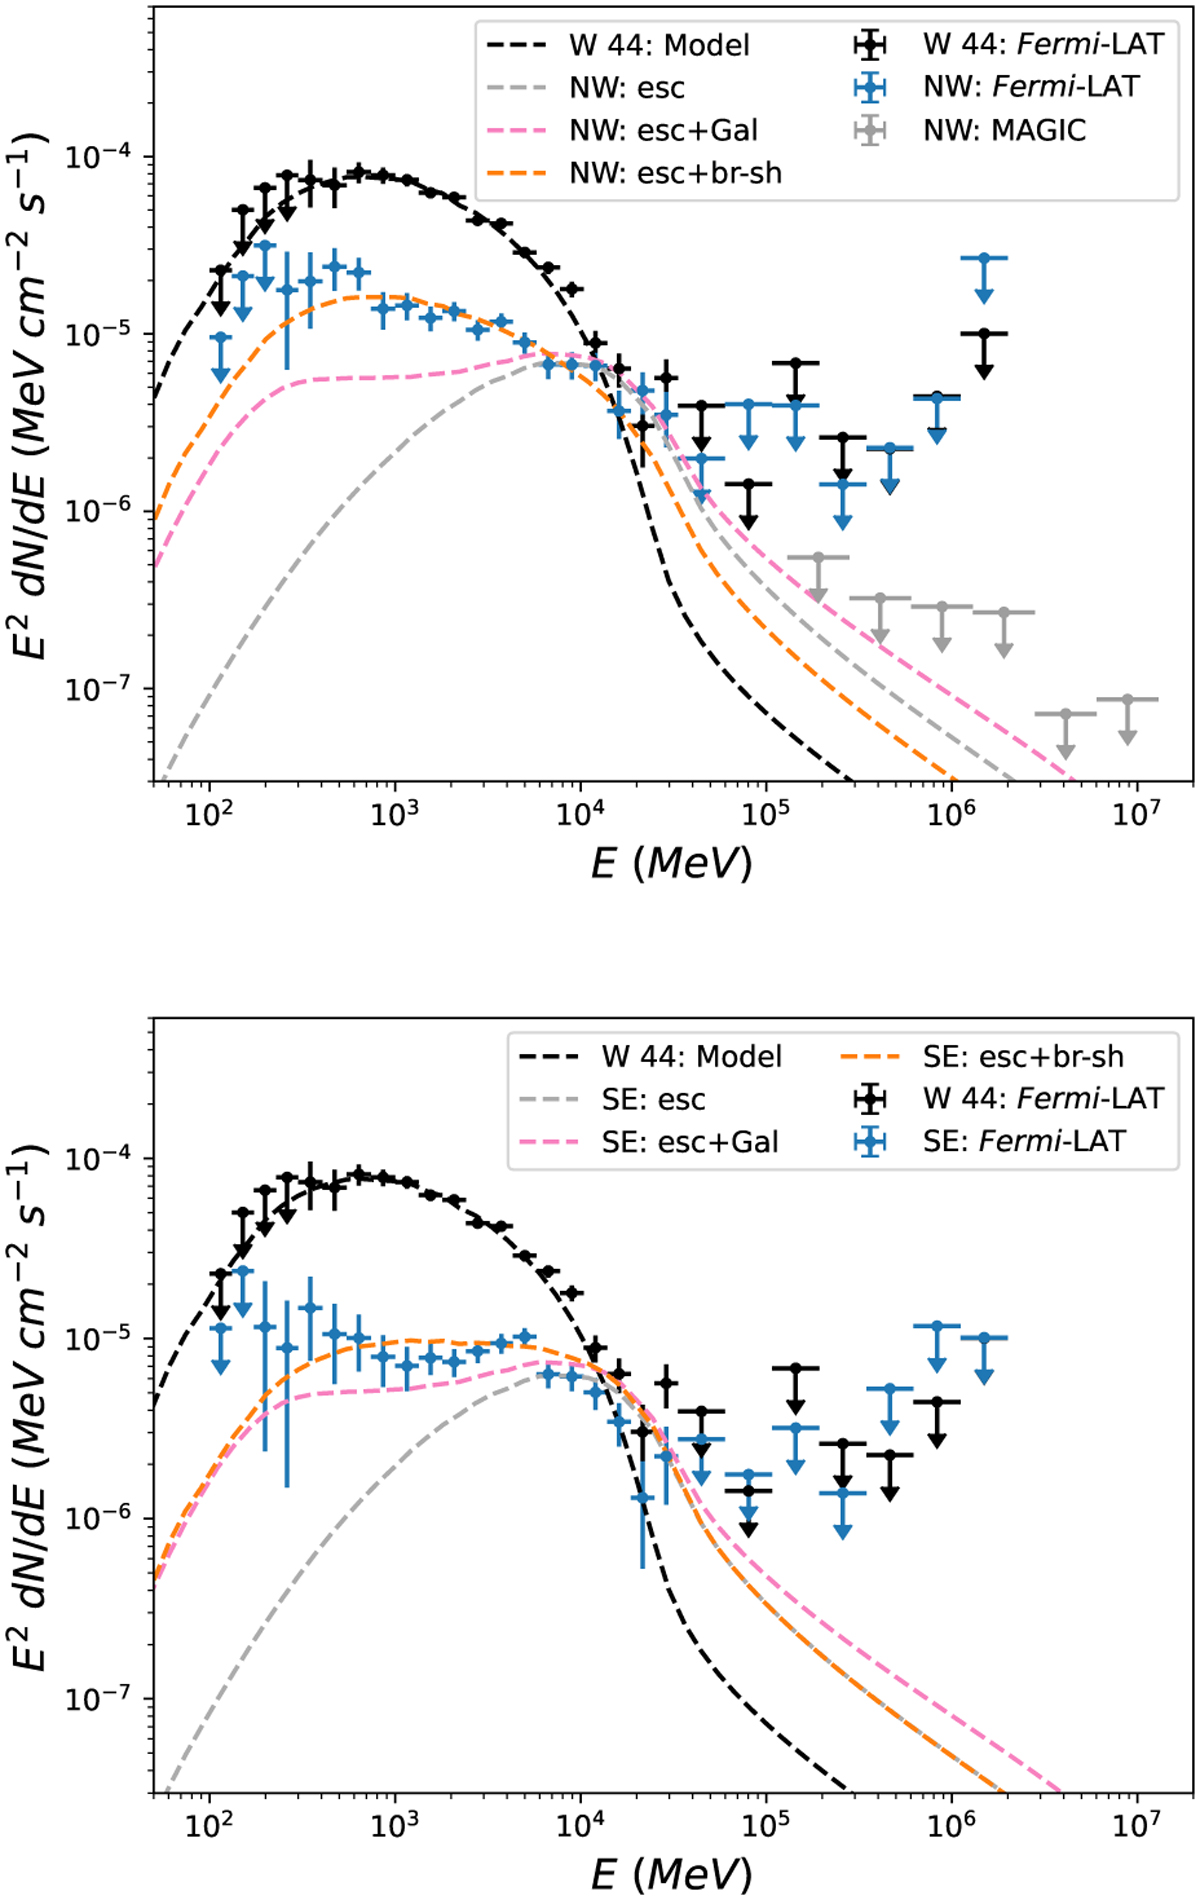
Gamma-ray emission from sources NW (top panel) and SE (bottom) compared to our model. The dashed gray line shows the emission from the high-energy particles escaping from the shock alone. The dashed pink line also includes an additional component due to Galactic CRs interacting with the cloud material, and the dashed orange line shows the sum of the dashed gray line with the contribution from the low-energy particles escaping from the broken-shock region. For comparison, the black points and dashed lines refer to the W44 emission.
Current usage metrics show cumulative count of Article Views (full-text article views including HTML views, PDF and ePub downloads, according to the available data) and Abstracts Views on Vision4Press platform.
Data correspond to usage on the plateform after 2015. The current usage metrics is available 48-96 hours after online publication and is updated daily on week days.
Initial download of the metrics may take a while.