Open Access
Fig. 3
Download original image
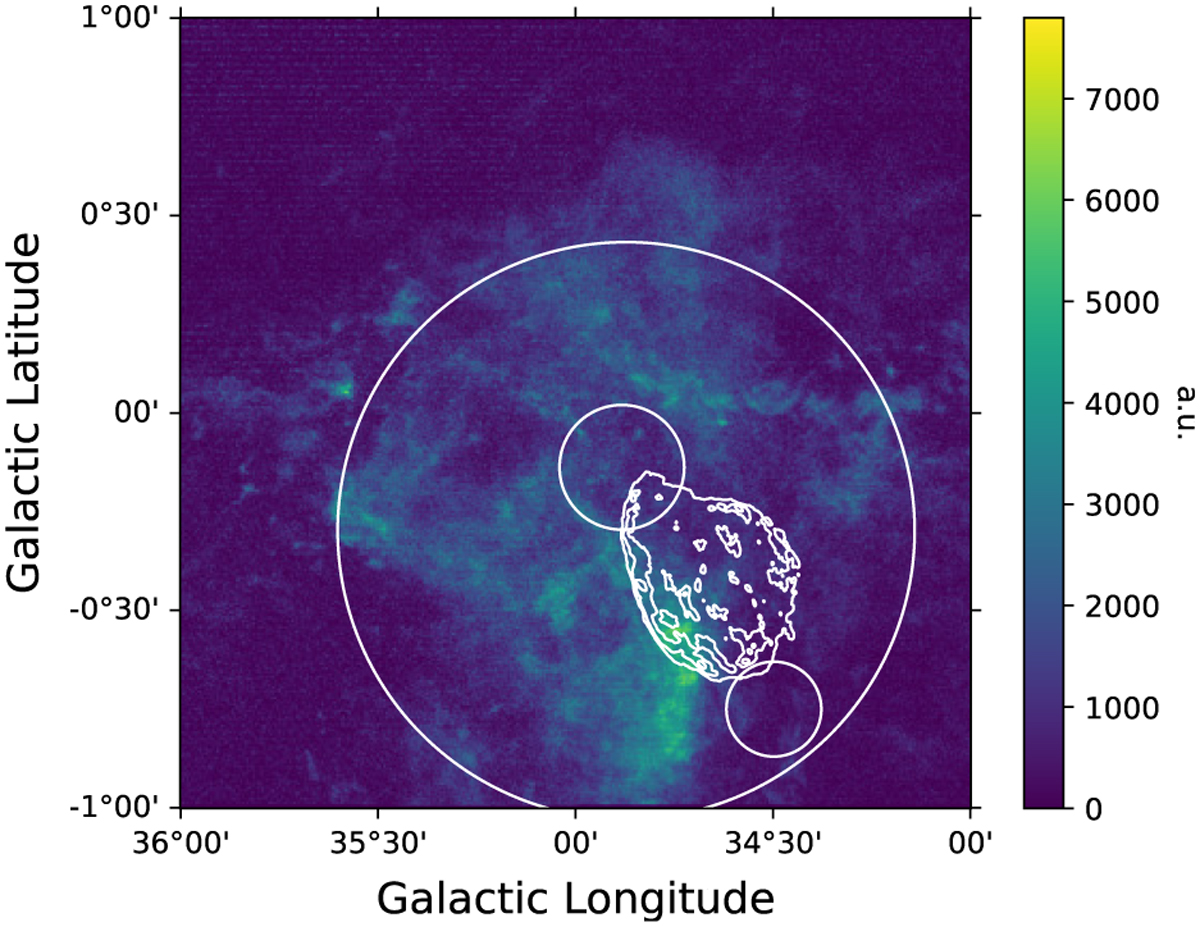
CO template derived from FUGIN survey in the velocity interval (38.6, 49.8) km/s. The template is the sum of the 12CO and 13CO data. For comparison, the white contours and circles represent the W44 radio contours and the extended sources derived from the Fermi-LAT analysis.
Current usage metrics show cumulative count of Article Views (full-text article views including HTML views, PDF and ePub downloads, according to the available data) and Abstracts Views on Vision4Press platform.
Data correspond to usage on the plateform after 2015. The current usage metrics is available 48-96 hours after online publication and is updated daily on week days.
Initial download of the metrics may take a while.