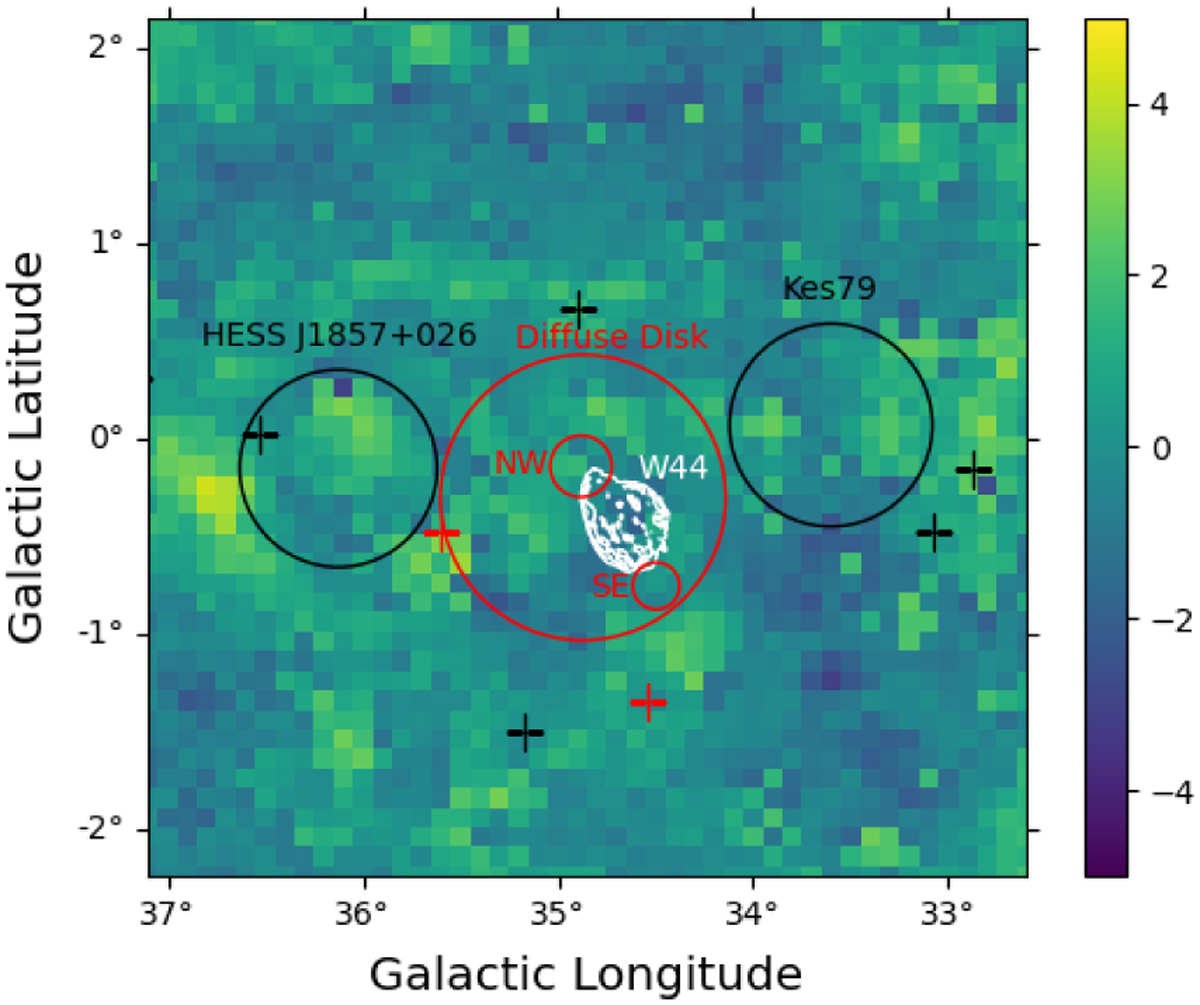
Fig. 2
Download original image
Fermi-LAT deviation probability map, or PS map, of the W44 surroundings with the best model obtained from the likelihood analysis. The white contours represent the W 44 radio template adopted in the analysis, derived from the template reported in Fig. 1e). The red crosses and circles show the new point-like and extended sources we added and fit in this analysis, and the black crosses and circles correspond to sources in the 4FGL-DR2 Fermi-LAT catalog for which the morphology was not changed. The radii of the circles represent the r68 of the extended sources that were modeled with a disk shape.
Current usage metrics show cumulative count of Article Views (full-text article views including HTML views, PDF and ePub downloads, according to the available data) and Abstracts Views on Vision4Press platform.
Data correspond to usage on the plateform after 2015. The current usage metrics is available 48-96 hours after online publication and is updated daily on week days.
Initial download of the metrics may take a while.