Fig. 3
Download original image
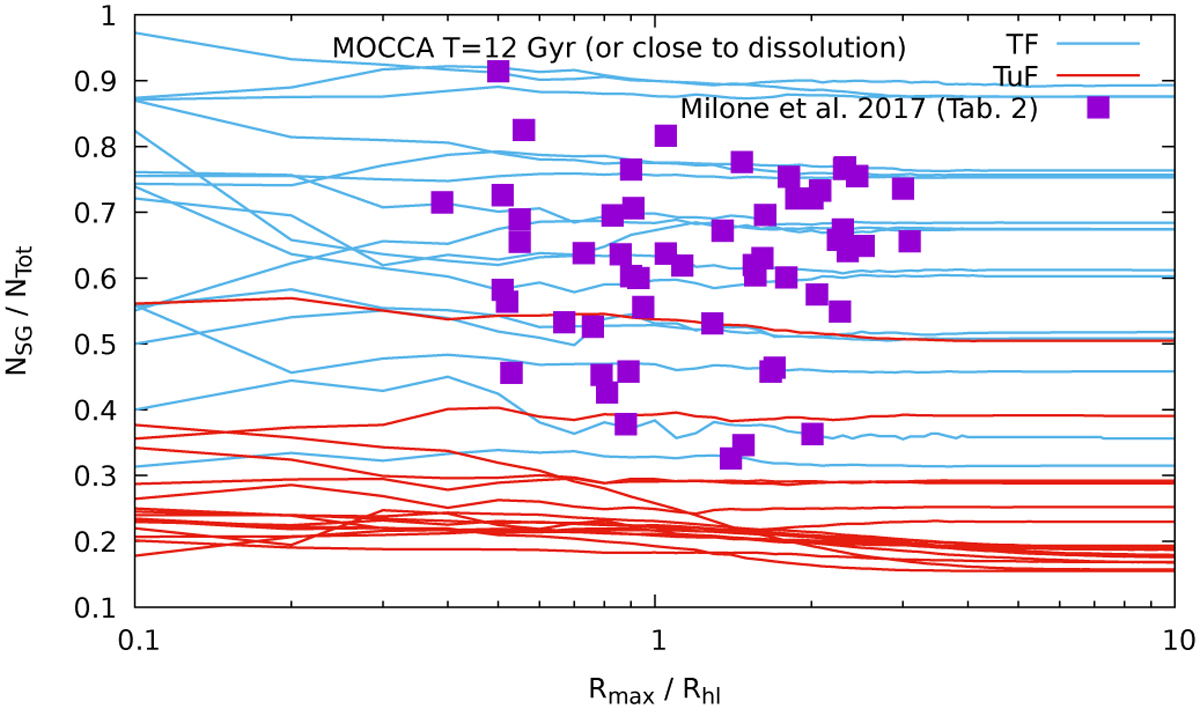
Milky Way GCs coverage with MOCCA models for 2D NSG/NTOT (Milone et al. 2017a) ratios computed as a cumulative value for different radii (scaled to rhl). Every line correspond to one MOCCA simulation. The selected MOCCA models are the same as in Figures 2 and A.1. The NSG/NTOT ratios are colored according to whether they were initially TF or TuF. Only for a few models is there a large difference for NSG/NTOT ratios between small and large radial distances (for those closer to dissolution). For the majority of the models there is no significant difference for NSG/NTOT ratios between those measured in the very center and those measured around rhl radius. For details see Section 4.
Current usage metrics show cumulative count of Article Views (full-text article views including HTML views, PDF and ePub downloads, according to the available data) and Abstracts Views on Vision4Press platform.
Data correspond to usage on the plateform after 2015. The current usage metrics is available 48-96 hours after online publication and is updated daily on week days.
Initial download of the metrics may take a while.