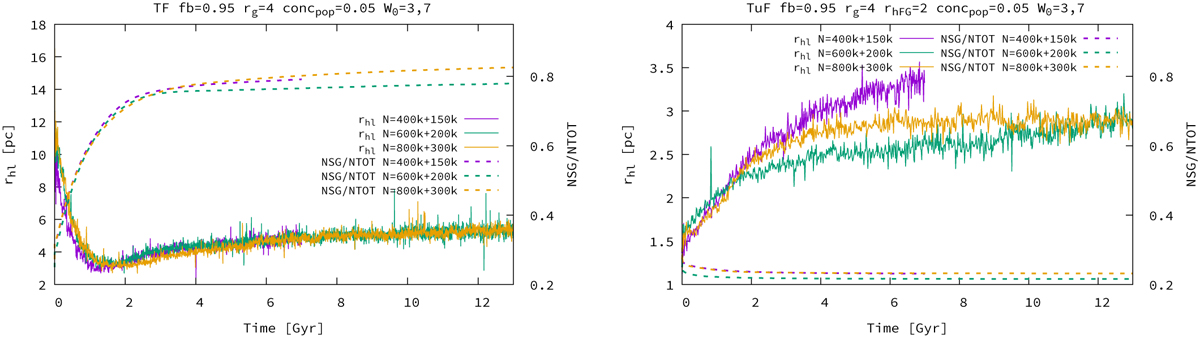
Fig. 2
Download original image
Evolution of NSG /NTOT ratios, together with half-light radii (rhl), for a set of MOCCA simulations. The figure consists of two series of MOCCA models: tidally filling (left, TF), and tidally underfilling (right, TuF). The main MOCCA initial parameters are summarized in the titles. In every plot there are 2–4 MOCCA models for which all initial parameters are the same, except one shown in the legend of each panel. In each panel, the left Y-axis shows the half-light radius (rhl (pc)), and the right Y-axis the NSG/NTOT ratio. The figure shows models differing in N, initial number of stars. The other varying parameters are: rg [kpc], galactocentric distance; fb, binary fraction; and Mmax [M⊙], maximum mass for the SG stars, and they are presented in an identical way in Figure A.1 in Appendix A.
Current usage metrics show cumulative count of Article Views (full-text article views including HTML views, PDF and ePub downloads, according to the available data) and Abstracts Views on Vision4Press platform.
Data correspond to usage on the plateform after 2015. The current usage metrics is available 48-96 hours after online publication and is updated daily on week days.
Initial download of the metrics may take a while.