Fig. 4.
Download original image
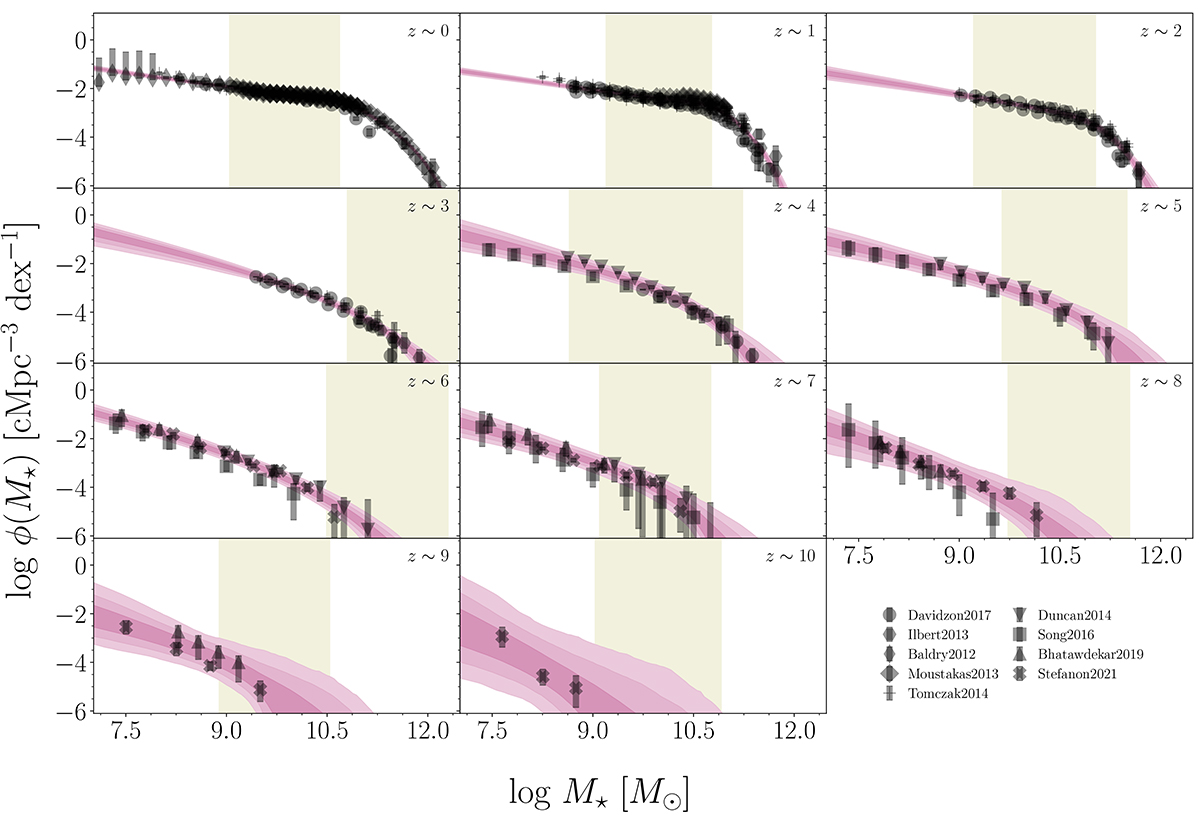
Credible regions of modelled galaxy stellar mass functions: The model number densities as calculated from Equation (3) matched to observational data. The credible regions cover (in decreasing order of colour saturation) 68%, 95% and 99.7% of the posterior distributions. The shaded area in the background marks the regime where the two feedback mechanisms contribute about equally to the stellar mass – halo mass relation given by Equation (4), the white area on the low-mass side is dominated by stellar feedback, ![]() , while the area on the high-mass side is AGN feedback-dominated,
, while the area on the high-mass side is AGN feedback-dominated, ![]() . The regime borders are calculated as the median value from a sample of GSMFs drawn from the posterior.
. The regime borders are calculated as the median value from a sample of GSMFs drawn from the posterior.
Current usage metrics show cumulative count of Article Views (full-text article views including HTML views, PDF and ePub downloads, according to the available data) and Abstracts Views on Vision4Press platform.
Data correspond to usage on the plateform after 2015. The current usage metrics is available 48-96 hours after online publication and is updated daily on week days.
Initial download of the metrics may take a while.