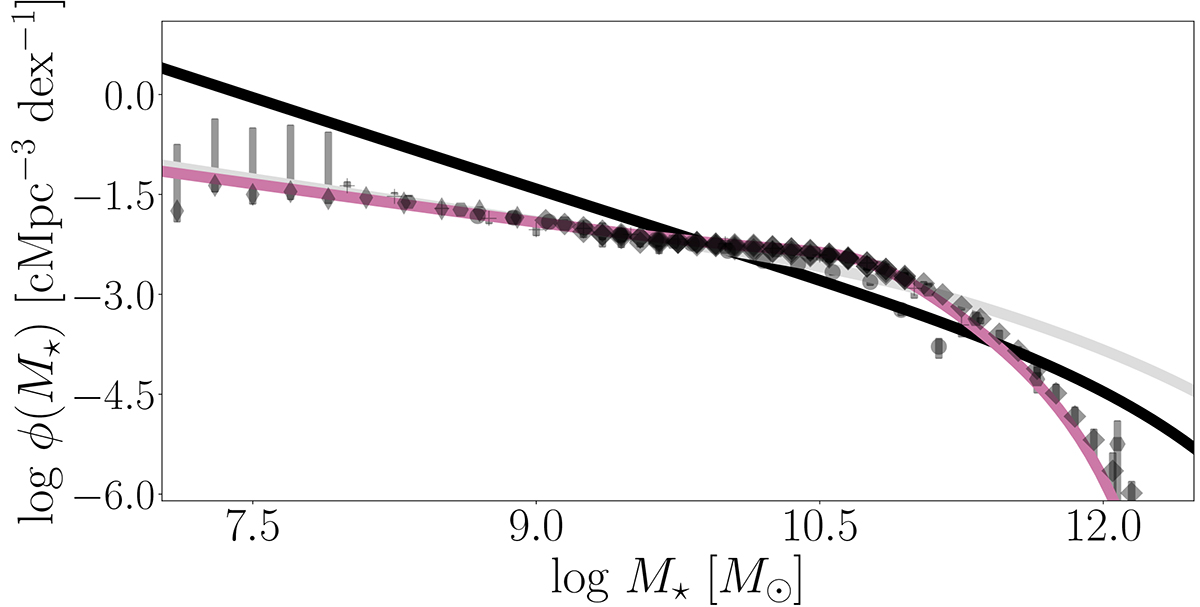
Fig. 2.
Download original image
Demonstration of feedback effects on GSMF: Least squares regression of Equation (3) to the observed galaxy stellar mass function at z = 0 (black dots, see text and Figure 4 for details). The black curve shows the maximum likelihood estimate for a model without feedback (γ⋆ = δ⋆ = 0), i.e. a simple scaling of the HMF; the light grey curve is a stellar feedback-only model (γ⋆ > 0, δ⋆ = 0), while the pink curve includes stellar and AGN feedback (γ⋆, δ⋆ > 0).
Current usage metrics show cumulative count of Article Views (full-text article views including HTML views, PDF and ePub downloads, according to the available data) and Abstracts Views on Vision4Press platform.
Data correspond to usage on the plateform after 2015. The current usage metrics is available 48-96 hours after online publication and is updated daily on week days.
Initial download of the metrics may take a while.