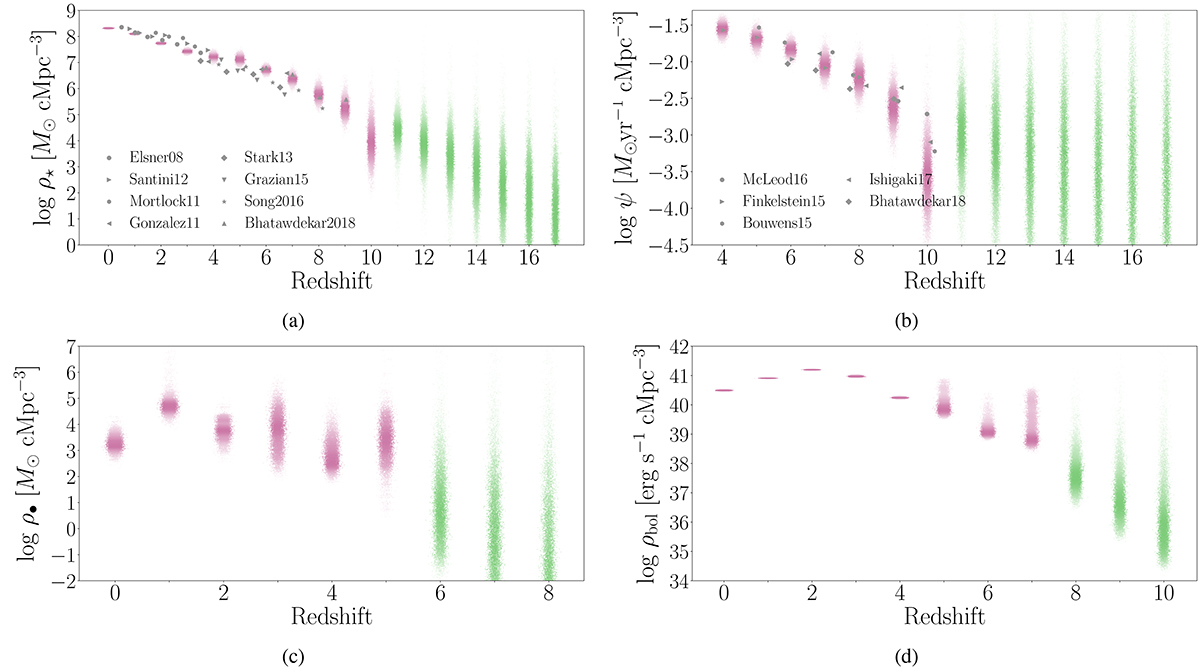
Fig. 13.
Download original image
Redshift evolution of the integrated densities: Integrated number density function calculated for a sample of the model parameter drawn from the posterior. Increased colour saturation indicates a larger value for the probability density. Distributions in pink have been constrained by data, while green distributions are linearly extrapolated. For Figures 13a and b, observations collected by Bhatawdekar et al. (2018) are shown in grey. (a) Stellar mass density. (b) SFR density. (c) Type 1 active black hole mass density. (d) AGN bolometric luminosity density.
Current usage metrics show cumulative count of Article Views (full-text article views including HTML views, PDF and ePub downloads, according to the available data) and Abstracts Views on Vision4Press platform.
Data correspond to usage on the plateform after 2015. The current usage metrics is available 48-96 hours after online publication and is updated daily on week days.
Initial download of the metrics may take a while.