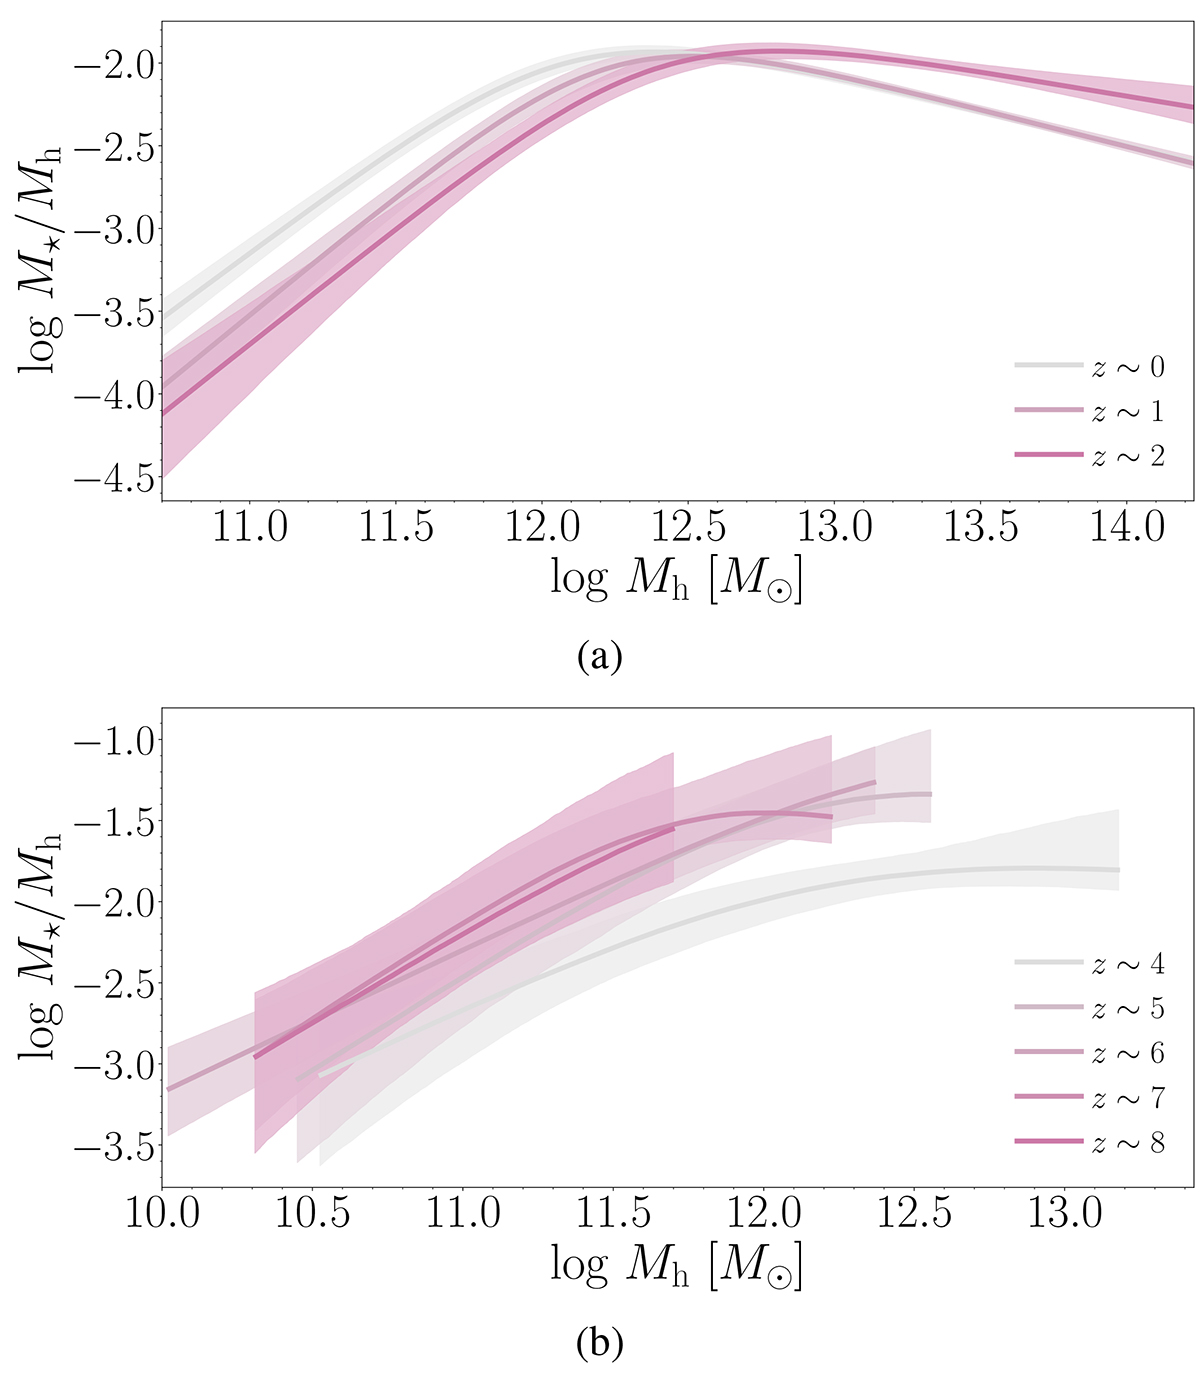
Fig. 12.
Download original image
Stellar mass – halo mass ratio across redshift. The SHMR is calculated to the parameter samples shown in Figure 11. The pink line shows the model median while the shaded areas represent the 95% credible regions. (a) Low redshift. (b) High redshift. The shown ranges in the figure coincide with the observed GSMFs. The high-mass slope is outside of the observed range
Current usage metrics show cumulative count of Article Views (full-text article views including HTML views, PDF and ePub downloads, according to the available data) and Abstracts Views on Vision4Press platform.
Data correspond to usage on the plateform after 2015. The current usage metrics is available 48-96 hours after online publication and is updated daily on week days.
Initial download of the metrics may take a while.