Fig. 10.
Download original image
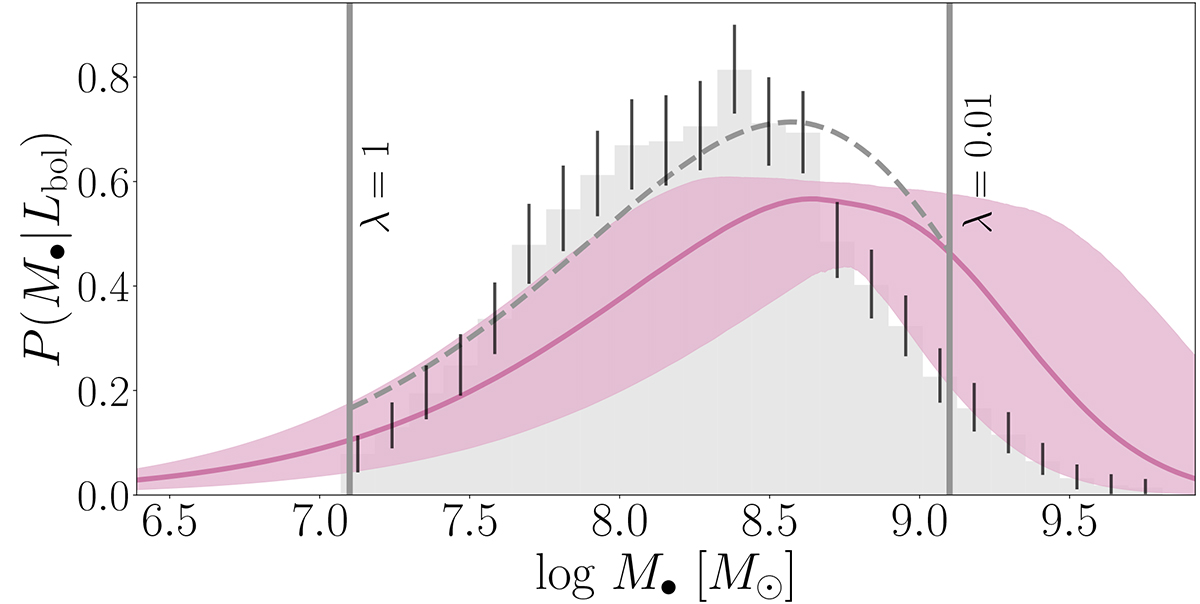
Probability density of black hole masses for log Lbol = 45.2 [erg s−1] at z = 0. The pink line shows the model median distribution with the 95% credible region, while the histogram shows the observational data on Type 1 AGN gathered from Baron & Ménard (2019). The grey vertical lines show where the Eddington ratio reaches 0.01 and 1, which marks the boundaries where we expect additional effects to play a role that are not included in the model. The grey dotted line is the expected distribution calculated from the MAP parameter estimates when invoking a hard cutoff outside of these boundaries. Doing so decreases the mismatch between the distribution means from 0.5 dex to 0.3 dex compared to the observational sample. The black lines mark the 95% credible region for the observational bins, based on the uncertainties in the black hole masses.
Current usage metrics show cumulative count of Article Views (full-text article views including HTML views, PDF and ePub downloads, according to the available data) and Abstracts Views on Vision4Press platform.
Data correspond to usage on the plateform after 2015. The current usage metrics is available 48-96 hours after online publication and is updated daily on week days.
Initial download of the metrics may take a while.