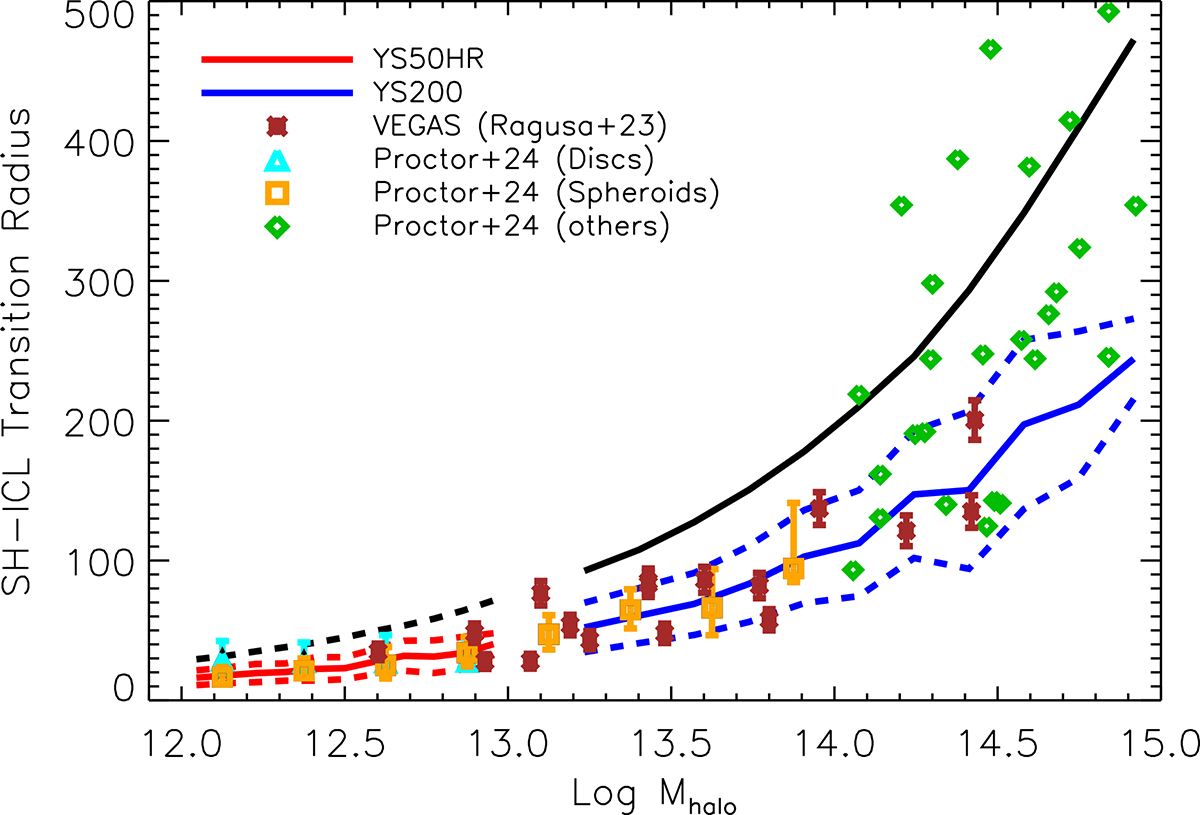
Fig. 1.
Download original image
Transition radius between the SH and the surrounding ICL as a function of halo mass. Our model predictions (red and blue lines) are compared with the results from Proctor et al. (2024) based on the Eagle (cyan and orange symbols) and C-Eagle (green symbols) simulations and extrapolations of observed data by Ragusa et al. (2023) from the VEGAS survey (brown symbols). For comparison, we show with dashed (YS50HR) and solid (YS200) black lines the scale radius-halo mass relation. Our model predictions are in very good agreement with both theoretical and observational measurements across the entire halo mass range investigated, and all data indicate an increasing transition radius with halo mass.
Current usage metrics show cumulative count of Article Views (full-text article views including HTML views, PDF and ePub downloads, according to the available data) and Abstracts Views on Vision4Press platform.
Data correspond to usage on the plateform after 2015. The current usage metrics is available 48-96 hours after online publication and is updated daily on week days.
Initial download of the metrics may take a while.