Fig. 8.
Download original image
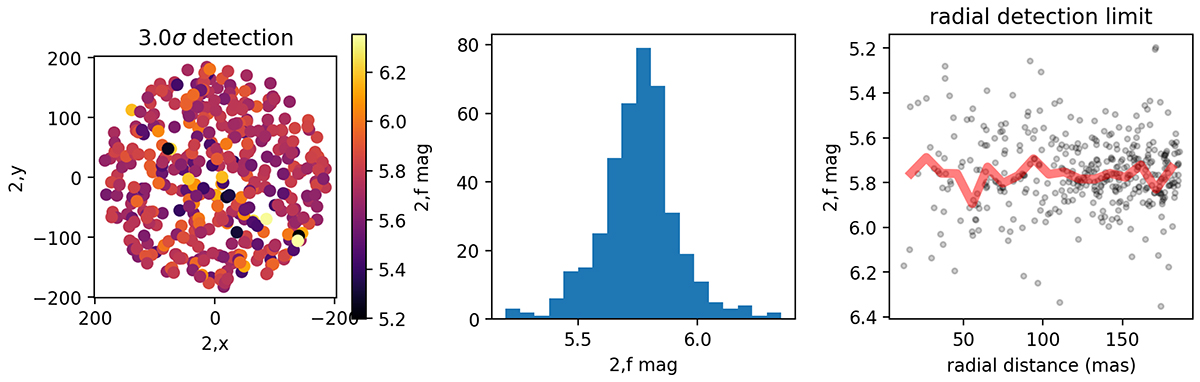
Companion detection limit plots for WR 18. The first plot shows a randomly created dense grid about 200 mas in radius around the central primary star that was used to inject a second point source and calculate the flux ratio needed for a 3σ detection. The scale for flux ratio is given in magnitude with reference to the primary. The second plot shows a histogram of limiting magnitudes over all the grid points. Lastly, the third plot shows detection limit as a function of radial distance, along with a rolling average in red.
Current usage metrics show cumulative count of Article Views (full-text article views including HTML views, PDF and ePub downloads, according to the available data) and Abstracts Views on Vision4Press platform.
Data correspond to usage on the plateform after 2015. The current usage metrics is available 48-96 hours after online publication and is updated daily on week days.
Initial download of the metrics may take a while.