Fig. 6.
Download original image
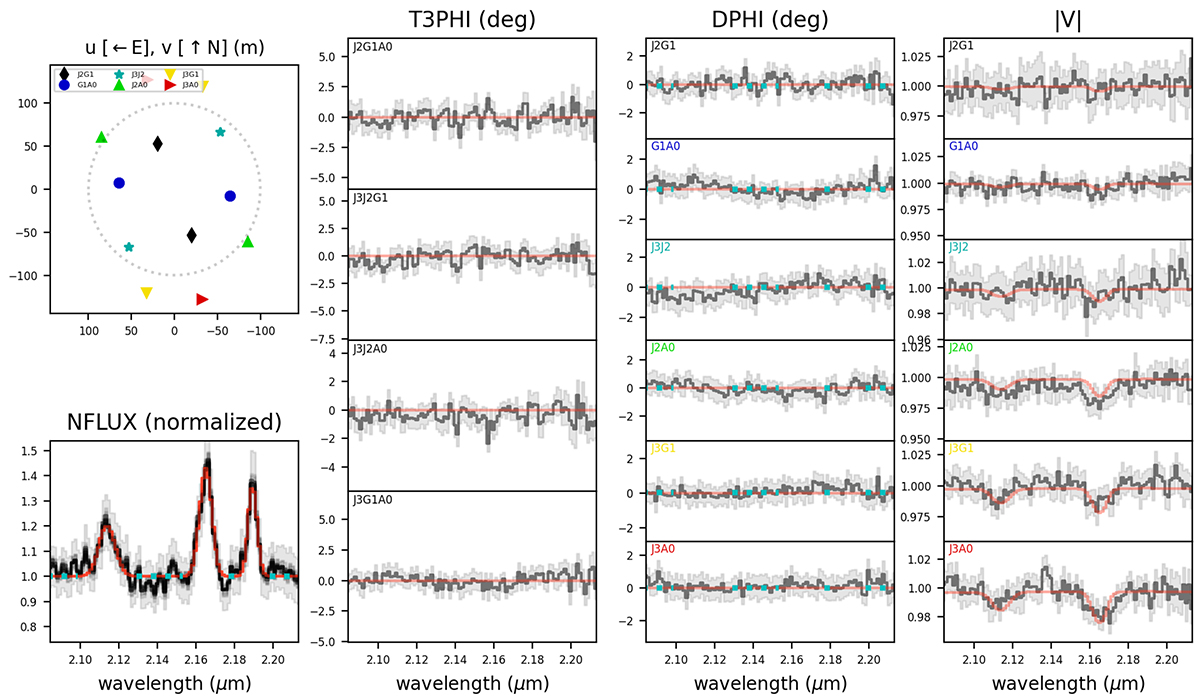
GRAVITY data for WR 78, a single WN7h star, along with the best-fit model shown in red. The top left panel shows the u-v coverage for the observation. The remaining panels, from left to right, show NFLUX, T3PHI, DPHI and |V| respectively, color-coded according to baselines. The data are zoomed in to a wavelength range of around 2.09–2.21 μm, with three strong emission lines present around 2.11, 2.16 and 2.19 μm. The |V| data show clear features corresponding to the first two spectral lines, decreasing in prominence from longer to shorter baselines. The best-fit model for such a system is an unresolved point source emitting the 2.19 μm spectral line and a slightly resolved Gaussian (fwhm ≈ 0.51 ± 0.02 mas) emitting the 2.11 and 2.16 μm spectral lines.
Current usage metrics show cumulative count of Article Views (full-text article views including HTML views, PDF and ePub downloads, according to the available data) and Abstracts Views on Vision4Press platform.
Data correspond to usage on the plateform after 2015. The current usage metrics is available 48-96 hours after online publication and is updated daily on week days.
Initial download of the metrics may take a while.