Fig. 2.
Download original image
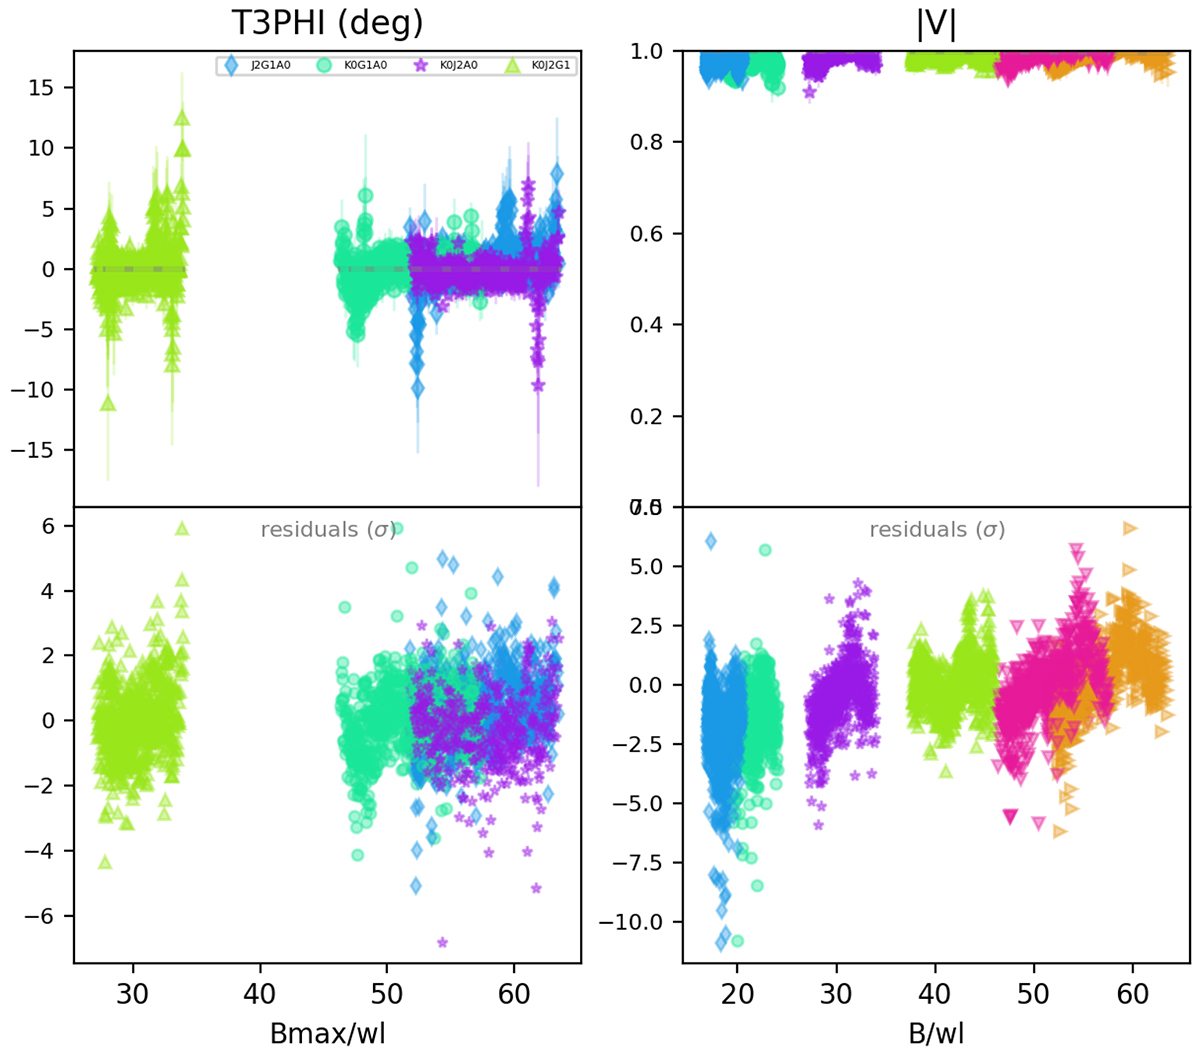
|V|-T3PHI data for the WN7h + O9III-V spectroscopic binary system WR 22. The different colors in T3PHI represent four combinations of 3 ATs each, while those in |V| represent the six baselines of 2 ATs each. The top panels show the best fit model (gray) along with the data, while the bottom panels show the residuals. The flat-at-zero T3PHI and flat-at-unity |V| data are typical of a single unresolved point source.
Current usage metrics show cumulative count of Article Views (full-text article views including HTML views, PDF and ePub downloads, according to the available data) and Abstracts Views on Vision4Press platform.
Data correspond to usage on the plateform after 2015. The current usage metrics is available 48-96 hours after online publication and is updated daily on week days.
Initial download of the metrics may take a while.