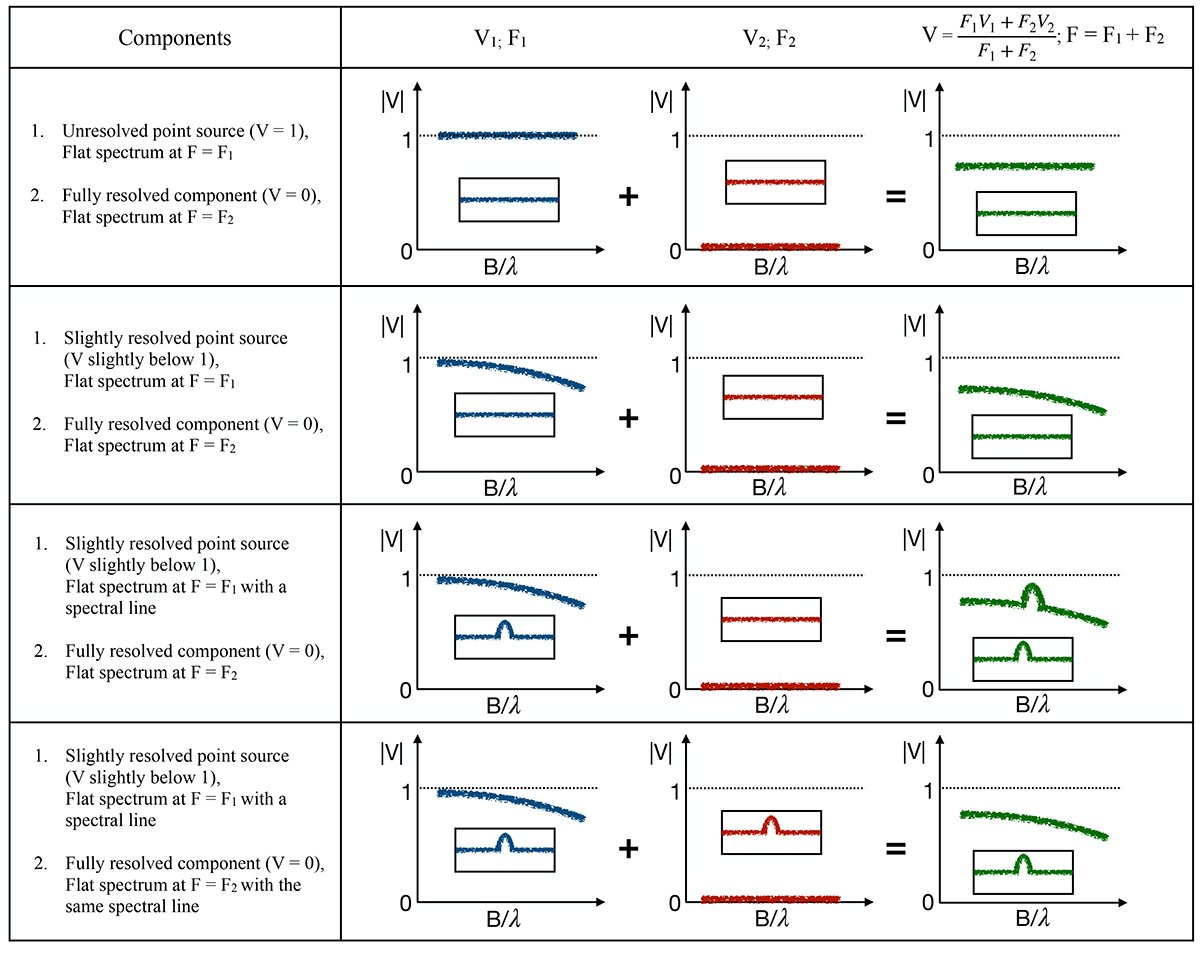
Fig. B.1.

Download original image
Four simple examples of |V| plots for two-component targets where one component is unresolved or slightly resolved and the other component is fully resolved. The first column describes the two components along with their flux properties, while the second column shows how the components add up together resulting in the combined |V|. The boxes in each plot show the spectrum. In interferometric data, we only have access to the final (green) plots and this table describes a qualitative approach to guessing the components present in the target based on |V|. Although the four examples serve as a good representative set, actual data and corresponding models can be much more complex, warranting the addition of more parameters.
Current usage metrics show cumulative count of Article Views (full-text article views including HTML views, PDF and ePub downloads, according to the available data) and Abstracts Views on Vision4Press platform.
Data correspond to usage on the plateform after 2015. The current usage metrics is available 48-96 hours after online publication and is updated daily on week days.
Initial download of the metrics may take a while.


