Fig. 10.
Download original image
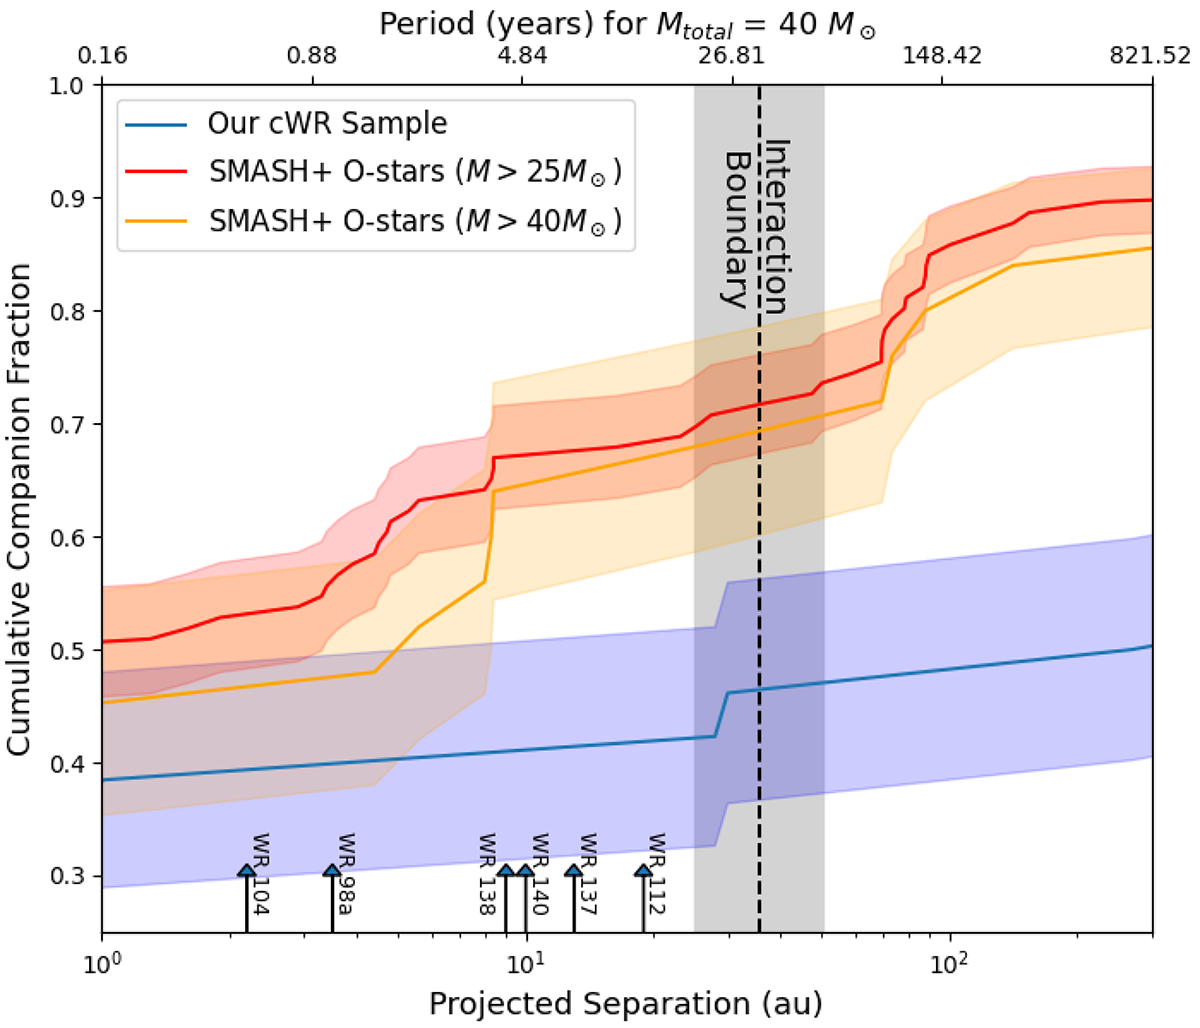
Cumulative companion fraction and corresponding binomial error regions plotted against the projected binary separation for cWR stars in our sample (blue) and O star primaries more massive than 25 M⊙ (red) and 40 M⊙ (orange) from the SMASH+ survey (Tramper et al., in prep.). The bottom horizontal-axis range is bound by the limits of the GRAVITY detection regime. The top horizontal-axis shows the orbital period for corresponding binary separations assuming a total system mass of 40 M⊙. Furthermore, the black dotted line represents an interaction boundary for the relatively extreme case of M1 = 40 M⊙, q = 1 and e = 0.3. The gray shaded region spans the eccentricity range from e = 0 to e = 0.5. Also shown are a few WR binaries from literature approximately placed on the plot for illustration.
Current usage metrics show cumulative count of Article Views (full-text article views including HTML views, PDF and ePub downloads, according to the available data) and Abstracts Views on Vision4Press platform.
Data correspond to usage on the plateform after 2015. The current usage metrics is available 48-96 hours after online publication and is updated daily on week days.
Initial download of the metrics may take a while.