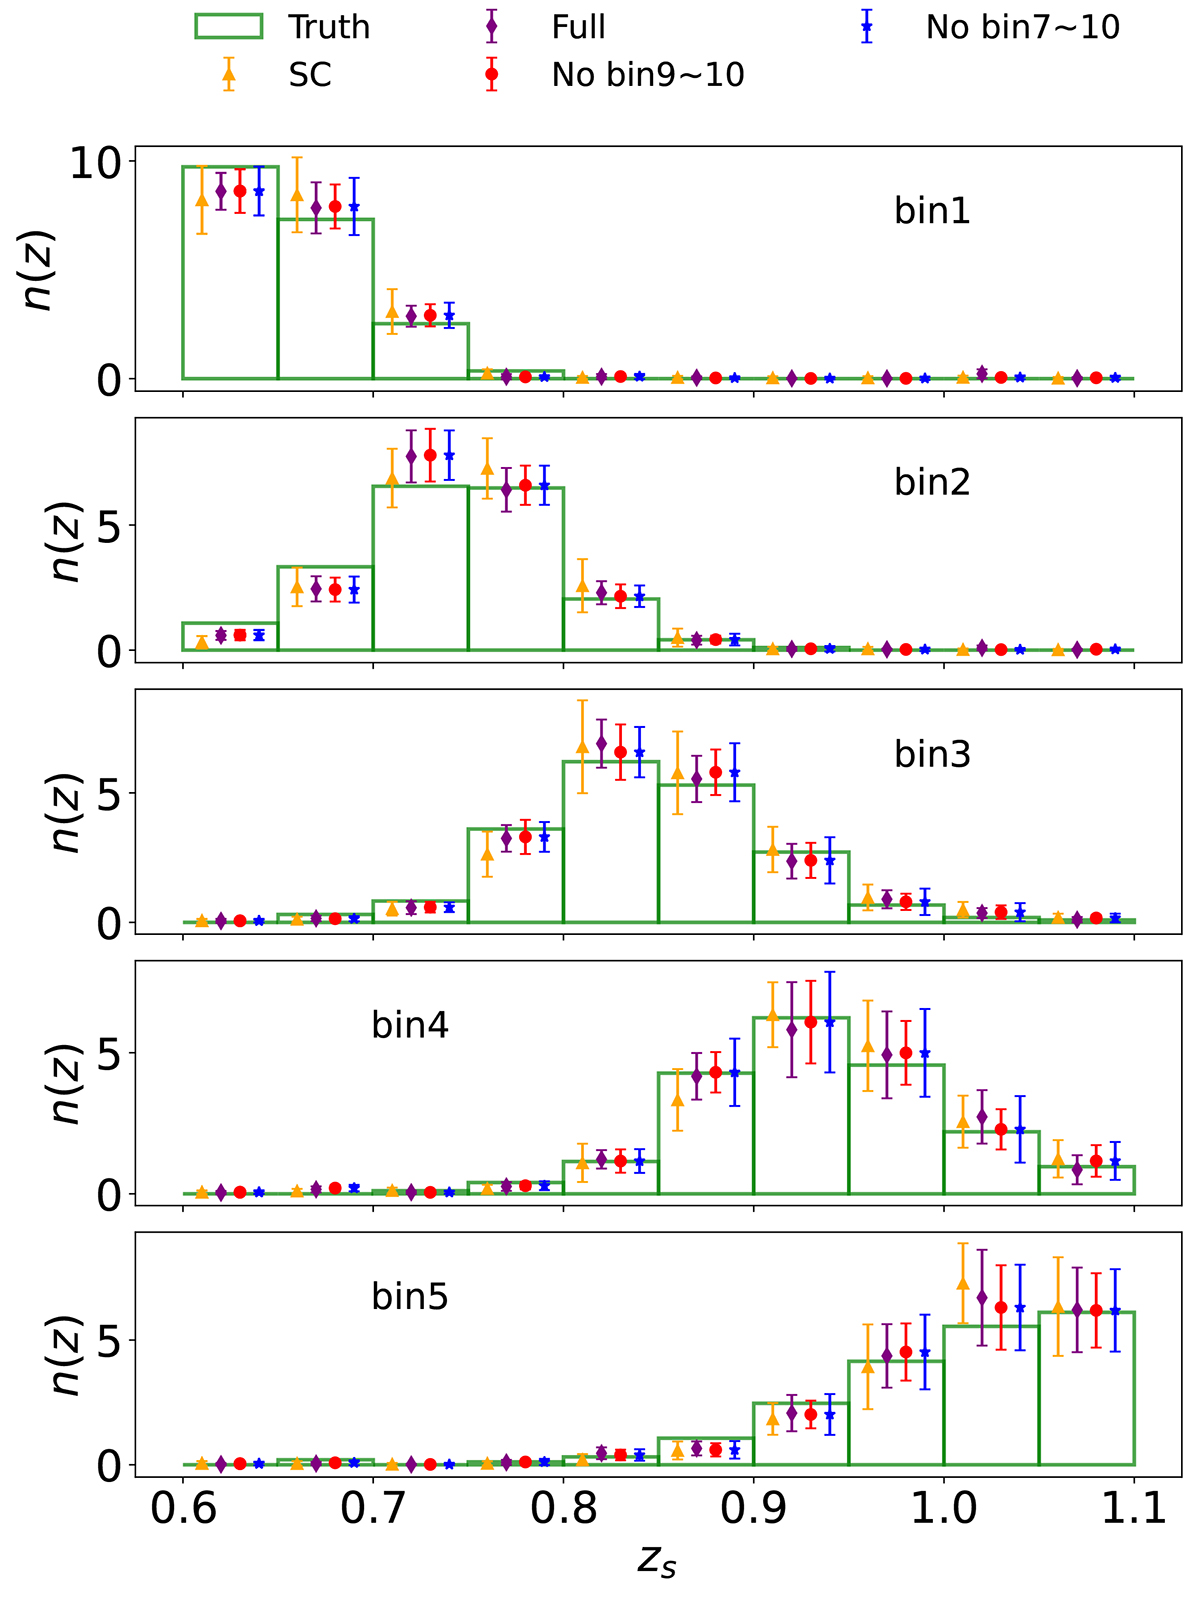
Fig. 9.
Download original image
Comparison of the true-z distribution obtained by different number of spec-z bins with spec-z data available against the direct measurement on the mock (green bars) for a single mock. We have presented the results from full spec-z bins (violet), no spec-z bin 9 and 10 (red), no spec-z bin 7 to 10 (blue), and SC only (orange).
Current usage metrics show cumulative count of Article Views (full-text article views including HTML views, PDF and ePub downloads, according to the available data) and Abstracts Views on Vision4Press platform.
Data correspond to usage on the plateform after 2015. The current usage metrics is available 48-96 hours after online publication and is updated daily on week days.
Initial download of the metrics may take a while.