Fig. 7.
Download original image
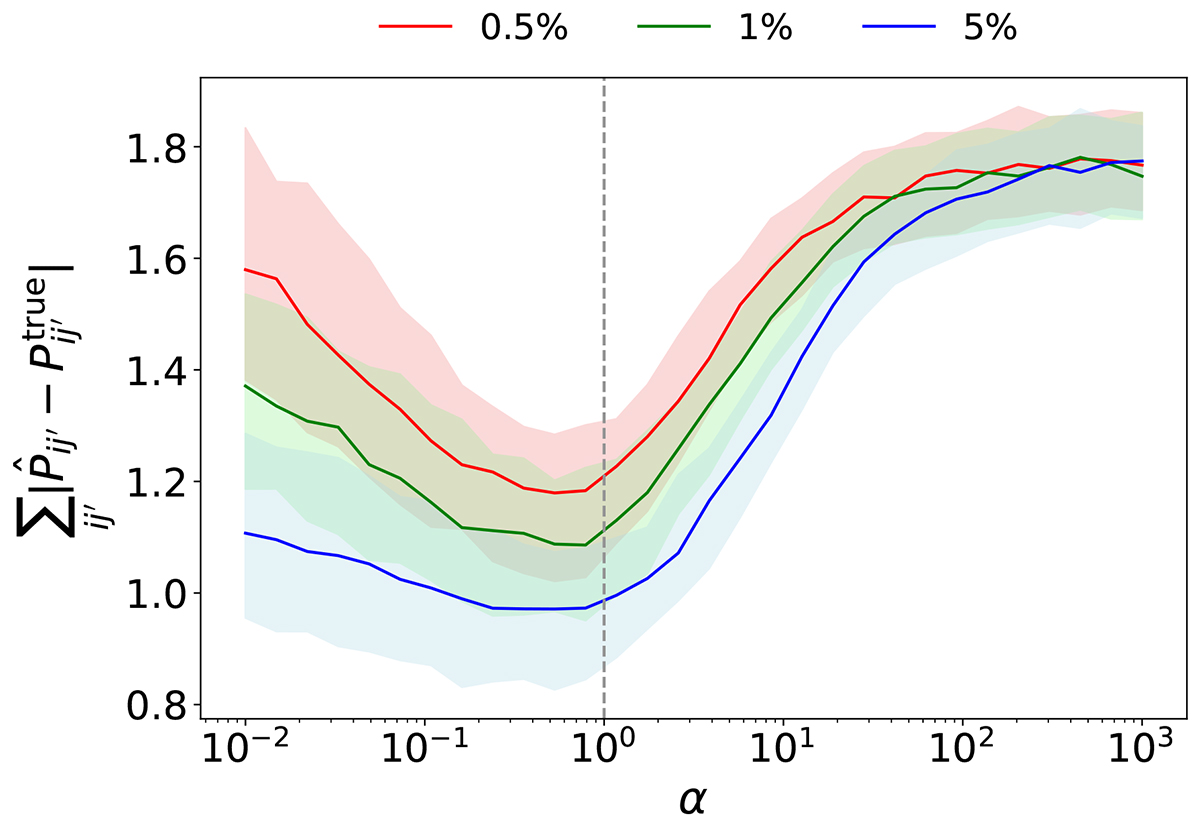
Accuracy of the true-z estimation characterized by ![]() , is plotted as a function of α, which measures the relative importance between SC and CZ. The line and the associated color band represent the median and the 16 and 84 percentiles among 100 mocks. We have shown the results for three spec-z sample consisting of the most massive 5%, 1%, and 0.5% galaxies in the spec-z sample. The black dashed line indicates the fiducial value α = 1.
, is plotted as a function of α, which measures the relative importance between SC and CZ. The line and the associated color band represent the median and the 16 and 84 percentiles among 100 mocks. We have shown the results for three spec-z sample consisting of the most massive 5%, 1%, and 0.5% galaxies in the spec-z sample. The black dashed line indicates the fiducial value α = 1.
Current usage metrics show cumulative count of Article Views (full-text article views including HTML views, PDF and ePub downloads, according to the available data) and Abstracts Views on Vision4Press platform.
Data correspond to usage on the plateform after 2015. The current usage metrics is available 48-96 hours after online publication and is updated daily on week days.
Initial download of the metrics may take a while.